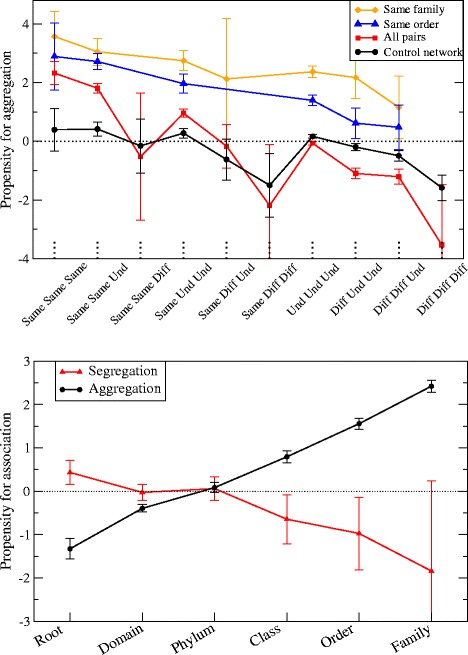
Figure 2.

Propensity to association versus environmental relatedness (top) and versus phylogenetic relatedness (bottom). In the top figure the x axis labels environmental relatedness at the three levels of subtype, type and supertype. For each level, three values of relatedness are possible: ’Same’ if the preferred habitat is the same, ’Und’ if it is undetermined for one or both taxa, and ’Diff’ if it is different.
