
Figure 5.
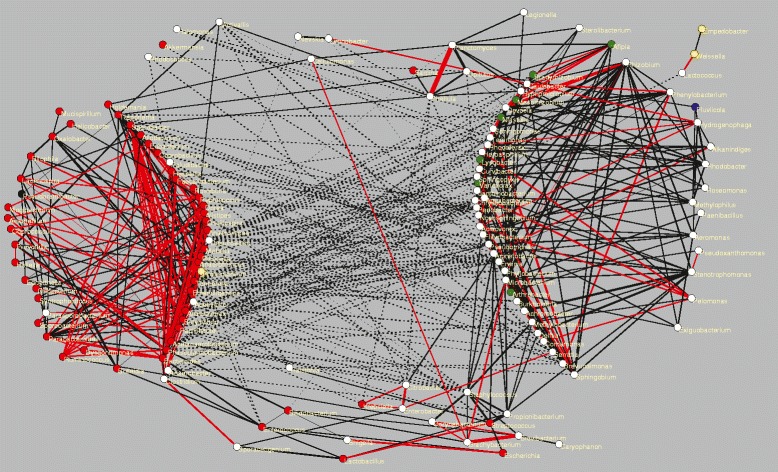
Networks obtained for taxa present in a group of samples related with animal guts. Solid lines represent aggregations, dashed lines represent segregations. Circles represent taxa, coloured according to the supertype to which at least 50% of the samples belong. (red = host, green = terrestrial, blue = aquatic, magenta = thermal, yellow = other, white = undefined). Red lines connect taxa belonging to the same family. The graphs have been plotted with the program Pajek [47].