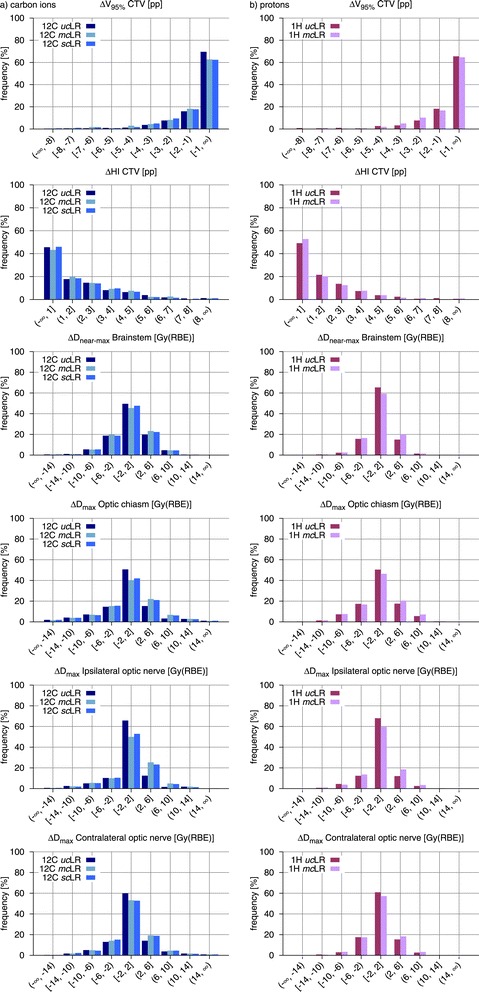
Figure 4.

Population frequency histograms of variations in dosimetric indices for all simulated setup errors and different optimization modalities. Frequency histograms of the observed CTV ΔV95%, CTV ΔHI and OAR ΔD(near-)max comparing LR treatment plans with different optimization modalities (uc, mc and sc) for (a) carbon ions and (b) protons. Abbreviations: CTV – clinical target volume, OAR – organ(s) at risk, LR – lateral-opposed beam setup, uc – unconstrained mode, sc – single-field modulation, mc – multiple-field modulation.
