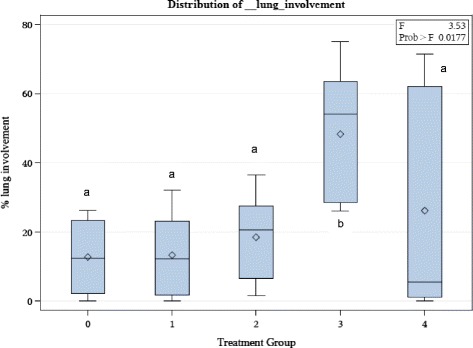
Figure 1.

Distribution of lung involvement. Distribution of percent lung involvement by treatment group. Treatment group 0: Negative control group, Treatment group 1: leukotoxin negative B. trehalosi group, Treatment group 2: leukotoxin positive B. trehalosi group, Treatment group 3: M. haemolytica group, Treatment group 4: Combination of leukotoxin negative B. trehalosi and M. haemolytica group. Means with different letters are significantly different (p < 0.05). Diamonds represent the group mean. Boxes represent the middle two quartiles of individual values, divided by the center line which represents the median. Bars adjacent to the boxes represent the outer two quartiles of individual values.
