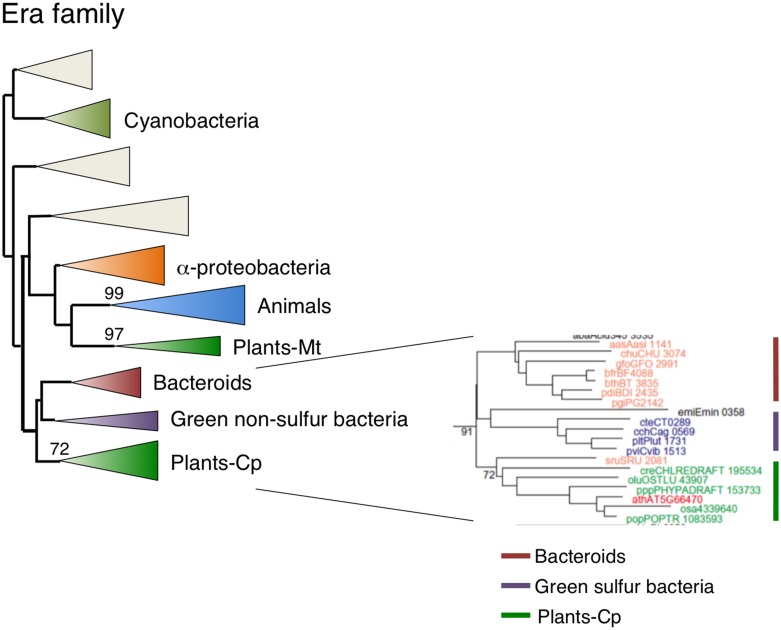
Figure 7.
Phylogenetic tree of Era subfamily proteins. Comprehensive comparison of Era subfamily proteins in eukaryotes, eubacteria and archaea. Sequences were aligned using Clustal X based on 141 genes. The tree was inferred using the neighbor-joining method with JTT model. Numbers at the nodes indicate bootstrap values obtained for 100 replicates. The horizontal length of the triangles is equivalent to the average branch length. Green triangle, plant clade; light green triangle, cyanobacterial clade; blue triangle, animal clade; orange triangle, α-proteobacteria clade; yellow triangle, green non-sulfur clade; red triangle, bacteroides clade. The original phylogenetic tree is shown in Figure S6.

