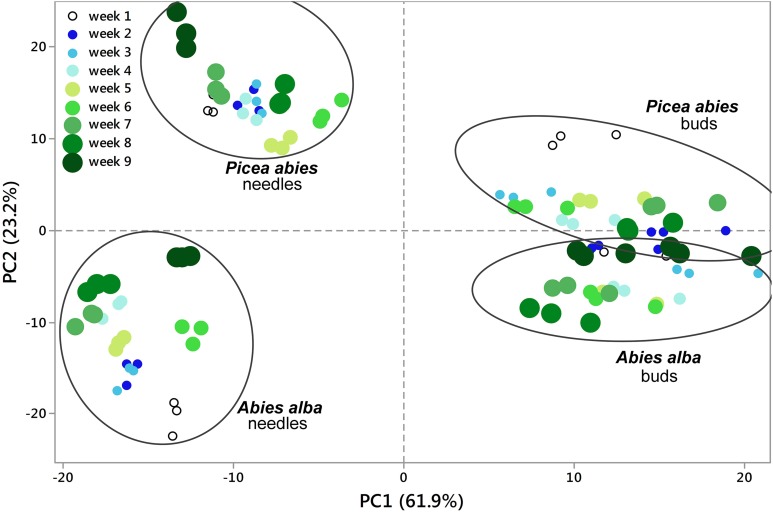
Figure 2.
Principal Component Analysis (PCA). 2D PCA was based on PC1 and PC2 from concentration values of all replicates (total of 108 metabolite profiles with 813 MS tags each). Segregation patterns could be shown for samples from week 1 through week 9, being more pronounced in needle tissue (See also Figures 1, 3). PC values were generated from log2(n) values of each single MS tag based on the median from all samples. See also Supplementary Table 1.

