Figure 4.
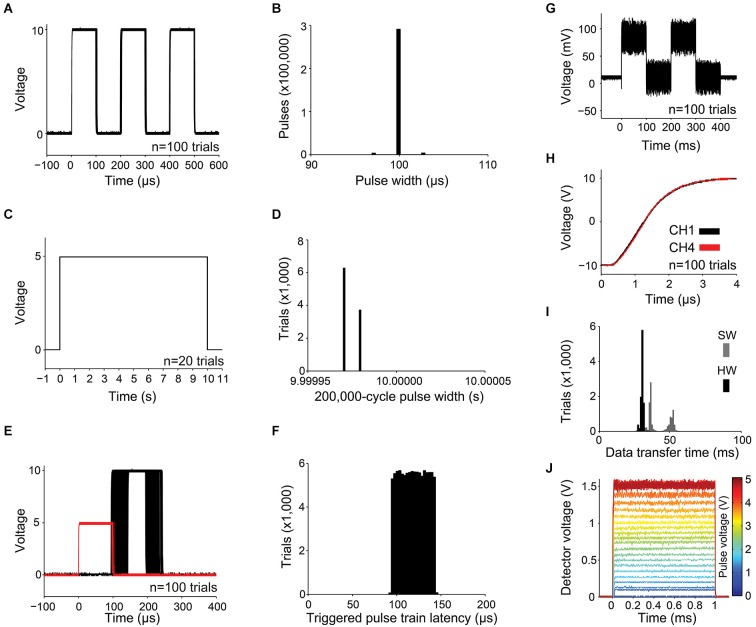
Measurements of precision and reliability. (A–B) For a train of three 100 µs pulses with 100 µs pulse intervals: (A) the first 100 waveforms captured with the oscilloscope are shown superimposed, and (B) distribution of pulse widths measured from 100,000 3-pulse trains, captured as in (A). (C–D) For a train of a single 10 s pulse: (C) waveforms from the first 20 trials and (D) 10,000 pulse widths. (E) The latency of a pulse train of one 10 V, 100 µs pulse captured from an output channel (shown in black for 100 trials) was measured with respect to a 5 V, 100 µs pulse delivered to a linked trigger channel (shown in red). (F) Distribution of pulse train latencies for 100,000 trials. (G) 100 superimposed 78.1 mV pulses, showing the smallest possible increment of the digital to analog converter and channel noise caused by digital feed-through from the SPI bus. (H) Simultaneous and rapid settling of the voltage on channels 1 and 4 when delivering a +10 V pulse from a resting voltage of −10 V. (I) USB transfer time is shown for a 5,006 byte message containing pulse times and voltages for a 1,000-pulse custom train. Transfer time was measured with hardware (HW, black; using firmware modified to indicate transmission start and end with a voltage pulse) and software (SW, gray; using the controlling computer’s clock). (J) 1 ms pulses of light, produced by controlling a blue diode laser with Pulse Pal, converted to voltage with an Si transimpedence amplified photodetector (PDA10A, ThorLabs), and captured with an oscilloscope. Single traces are shown for voltage pulses ranging from 78 mV to 5 V in amplitude.

