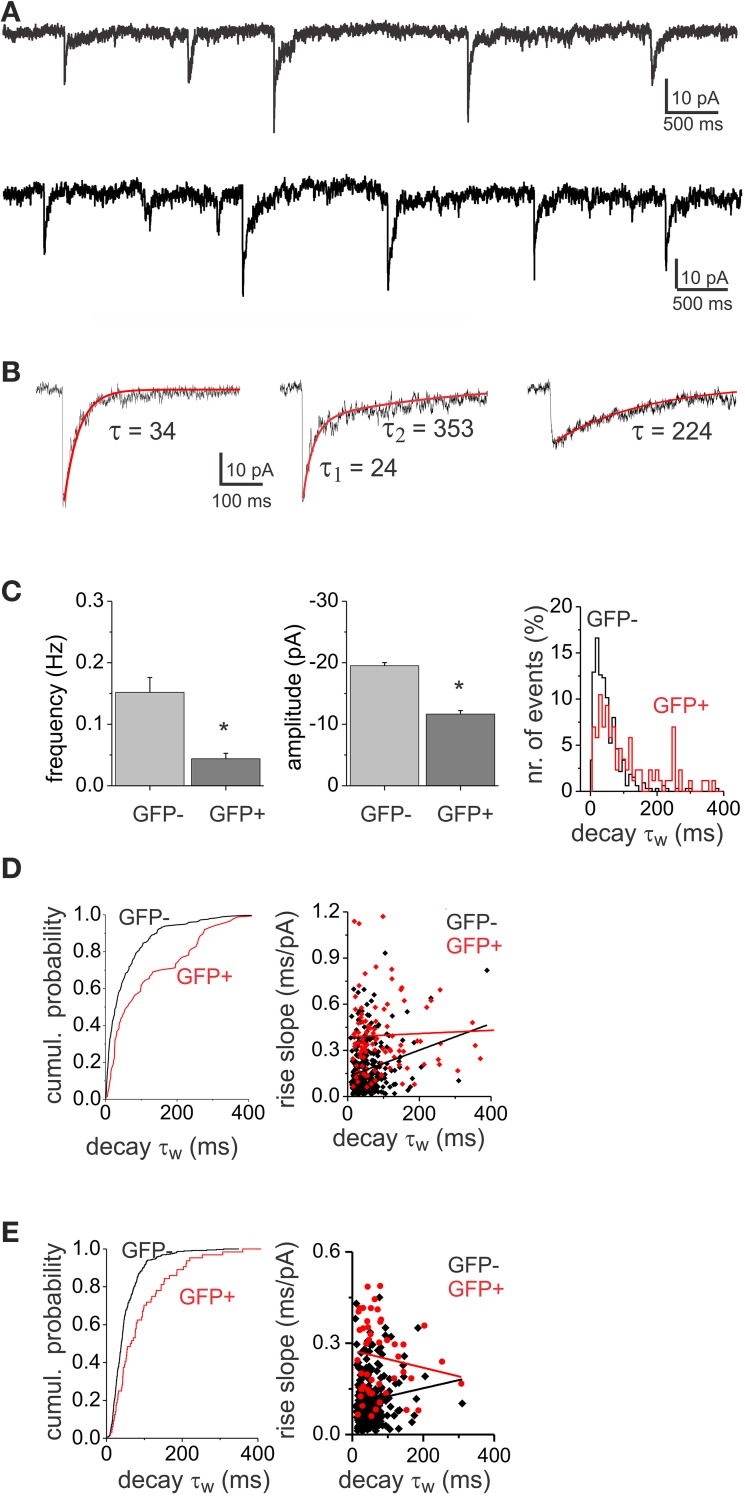
Figure 3.
GABAA mIPSCs show both fast- and slow-decay kinetics. (A) Example of a recording of mIPSCs from a GFP+ (top) and a GFP− (bottom) neuron displaying variable decay kinetics. (B) Different examples of single mIPSCs with variable decay kinetics: fast (left), mixed (middle) and slow decay (right) events. (C) Histograms of mIPSC frequency and amplitude showing significant differences (asterisk) between GFP− (n = 6) and GFP+ (n = 6) cell populations. The population distribution histogram of decay time constants (left, bin width: 20 ms) shows that GFP− and GFP+ display different proportions of fast and slow mIPSCs. (D) The cumulative probability plot (left) shows differential distribution of mIPSC decay τw between GFP− and GFP+ cell populations (left, p < 0.05 Kolmorgorov-Smirnov test). The plot consists of pooled mIPSC decay time constants from 6 GFP− and 6 GFP+ cells. The same number of consecutively occurring mIPSCs from each cell was used. The relationship between 10 and 90% rise slope and the decay τw in EGFP− and EGFP+ mIPSCs is plotted on the right. There was no correlation between mIPSC rise and decay neither in GFP− (r = 0.22) nor in GFP+ (r = 0.05) neurons. (E) Cumulative probability plot (left) and rise-slope/decay τw relationship plot (right) of the subset of data with rise times <4 ms. The distribution of decay τw between GFP− and GFP+ cells was different (p < 0.05), while there was no correlation between rise time and decay τw in GFP− (r = 0.11) and GFP+ (r = 0.14) neurons.

