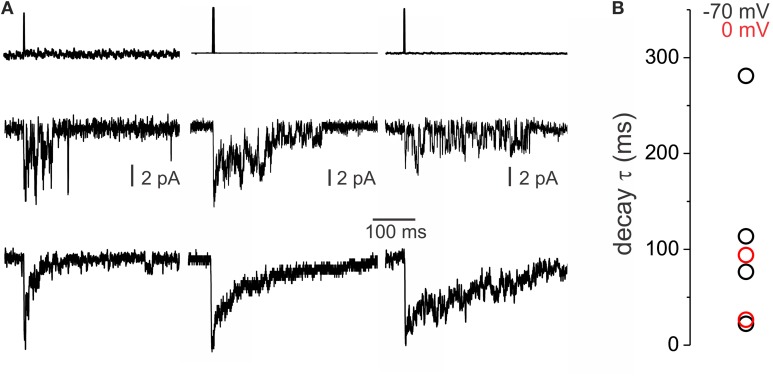
Figure 6.
Heterogeneity of decay kinetics of transient GABAA currents in outside-out patches. (A) Current traces showing responses to rapid application (1 ms pulse) of 1 mM GABA of varying decay times in different membrane patches. On top, the average of the liquid junction current recording is shown. In the middle, traces from a single application are shown. Average traces of multiple applications on the same membrane patches are shown at the bottom. (B) Graph showing the decay τ of individual excised patches. In black are shown outside-out patches recorded with high Cl− pipette solution and a holding of −70 mV while in red are recordings from excised patches made with low Cl− pipettes at 0 mV holding potential.

