Figure 7.
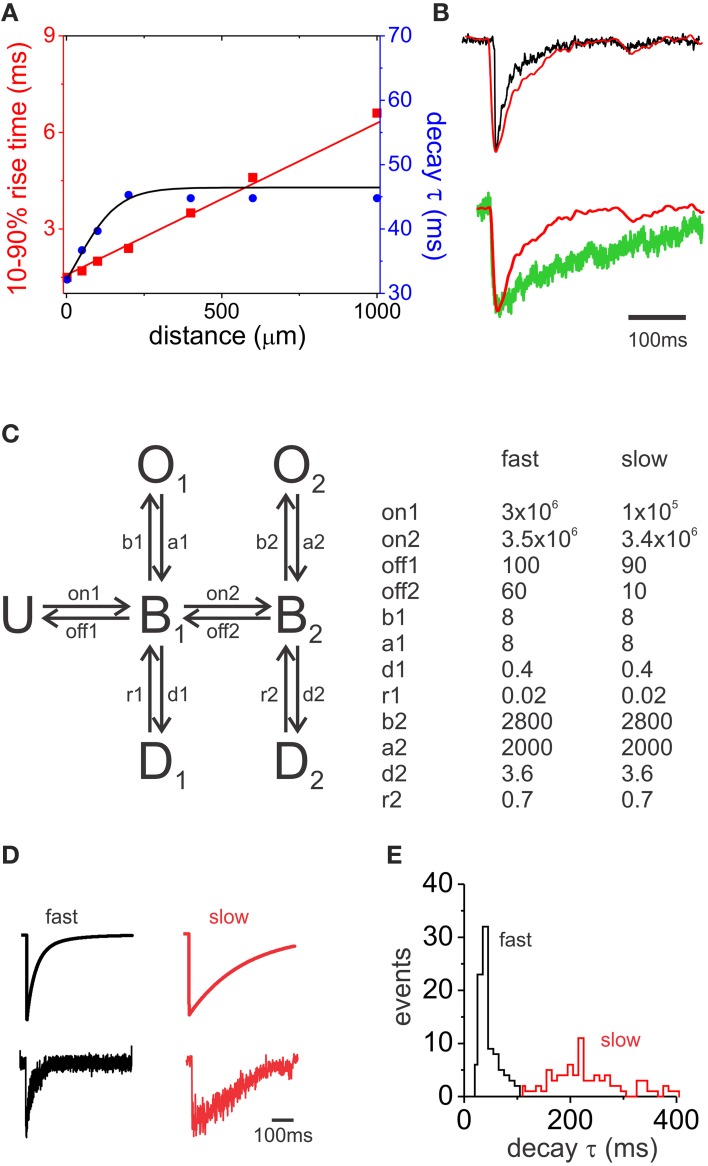
Simulation of mIPSC decay kinetics. (A) The graph illustrates the changes in 10–90% rise time and decay τ in relation to the distance of the synapse from the soma in a model cell. A recorded fast mIPSC was used as a synaptic conductance. (B) Top, superimposed synaptic currents measured at the soma for synapses located at 0 μm (black) and 1000 μm (red) away from the soma. Traces were aligned at the peak. Bottom, superimposed traces from a synaptic current originating 1000 μm away from the soma of the model cell (red) and a slow decaying recorded mIPSC (green). (C) Schematic representation of the six-state Markov model of GABA receptor activation used (left). U, unbound; B, bound; O, open,; and D, desensitized states. A list of rate constants used to simulate fast and slow decay GABA currents is shown on the right. on1 and on2 binding rate constants are in M−1s−1 and the rest rate constant in s−1. (D) Top, computationally generated macroscopic current simulations for fast and slow decay parameters. Bottom, examples of simulated GABAA mIPSCs resulting from the summation of stochastic opening of 20 single channels. (E) Population histogram showing the distribution of decay τ for fast (black) and slow (red) simulated mIPSCs.

