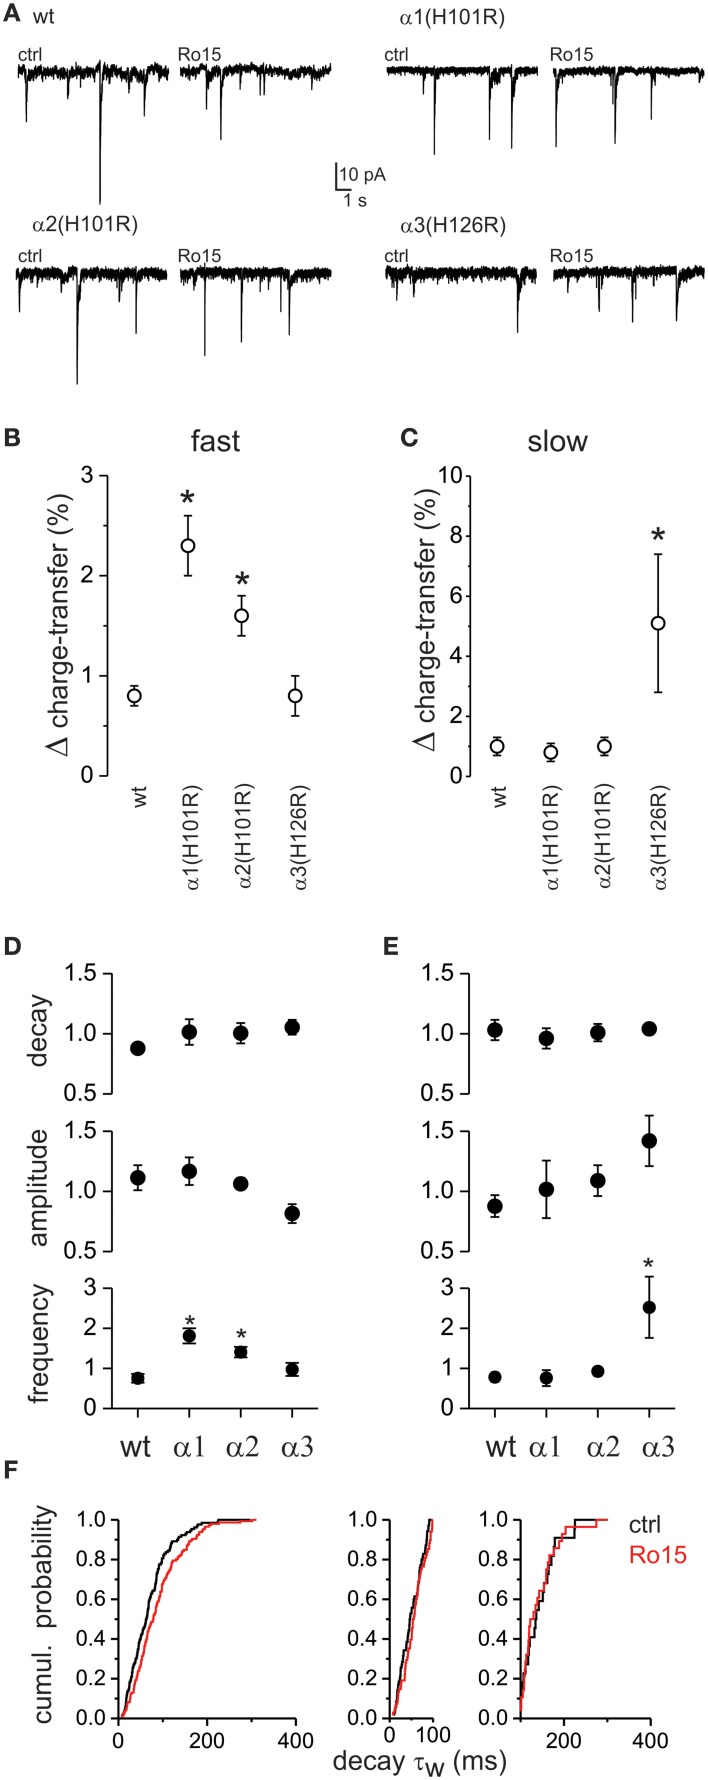
Figure 8.
Differential role of α-subunits in shaping GABAA IPSC decay kinetics. Effect of the partial benzodiazepine inverse agonist Ro15-4513 on fast and slow mIPSCs in control (wt), α1(H101R), α2(H101R), and α3(H126R) knock-in mice. (A) Example traces of mIPSC recordings before (ctrl) and during Ro 15-4513 in the different mouse lines. (B) The relative change in total mIPSC charge transfer (Δ charge-transfer) mediated by fast decay mIPSCs after the application of Ro15-4513. (C) The relative change in the Δ charge-transfer mediated by slow decay mIPSCs after the application of Ro15-4513. (D) The relative changes in mIPSC decay τ, amplitude and frequency for fast decaying mIPSCs after the application of Ro15-4513. (E) The relative changes in mIPSC decay τ, amplitude and frequency for slow decaying mIPSCs after the application of Ro15-4513. Asterisks denote significant difference between cells taken from wild type and knock-in mice (ANOVA with post-hoc Tukey test, p < 0.05, n = 9, 6, 6, and 6 respectively). (F) The cumulative probability plot of mIPSC decay τw for α3(H126R) knock-in mice (left) is shown before (ctrl) and during Ro 15-4513. Application of Ro 15-4513, shifted the decay τ distribution to the right, as expected by the increase in frequency of the slowly decaying mIPSCs subpopulation. Indeed, the cumulative probability plots for the fast (middle) and slow (right) subpopulations of the α3(H126R) mIPSC decay τw show no differences between ctrl and Ro15 in their distribution. All plots consist of pooled data from six α3(H126R) neurons. The same number of consecutively occurring mIPSCs from each cell was used.

