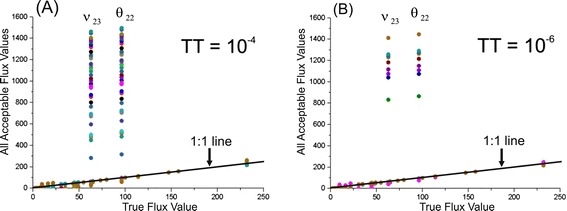
Figure 3.

Comparison of true flux values with flux parameters corresponding to all χ 2 –statistically acceptable values of the objective function. The fluxes that successfully coincide with true values lie on the 1:1 line when plotted against the true flux. The fluxes estimated from the same iterative trial are indicated by the same color. (A) The termination tolerance, TT, is equal to the default value of 10−4; (B) TT =10−6.
