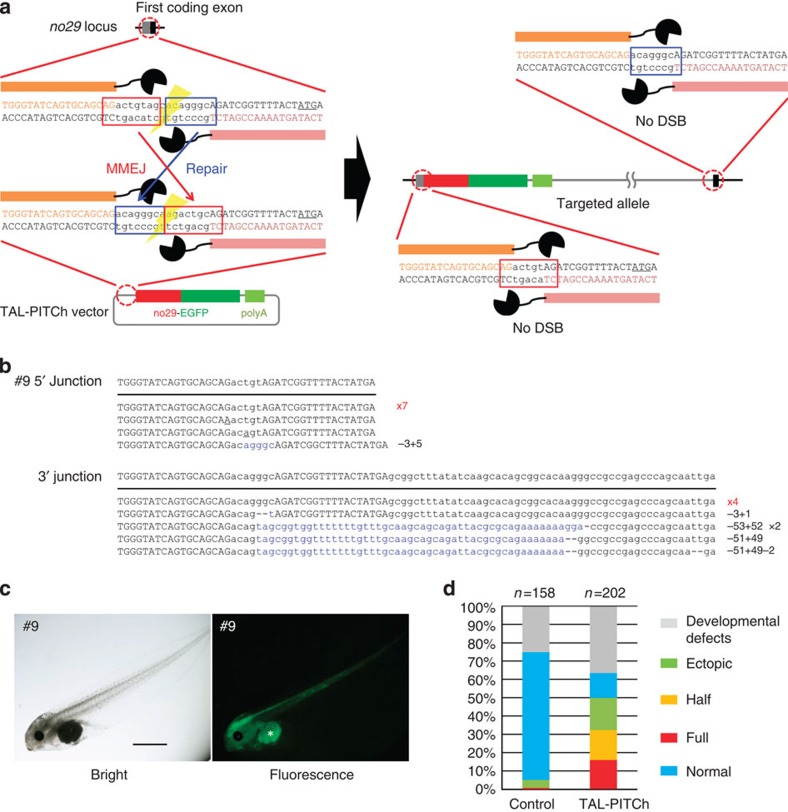
Figure 3. TAL-PITCh at the no29 locus in frog embryos.
(a) Schematic illustration of TAL-PITCh at the X. laevis no29 locus. Orange and pink letters indicate the left and right TALEN target sites, respectively. Red and blue boxes indicate the microhomologous sequences. The start codons are underlined. (b) Sequences of knocked-in alleles from embryo #9. The intended knocked-in sequence is shown at the top. TALEN target sites are shown in capital letters. Red letters indicate correctly knocked-in alleles. Blue letters indicate insertions. Dashes indicate deletions. Substitutions are underlined. (c) Bright-field and fluorescence microscopy images of embryo #9. An asterisk indicates yolk autofluorescence. Scale bar, 1 mm. (d) Percentage of phenotypes in the control embryos and the TAL-PITChed embryos. For the control, the vector from which the TALEN target site was removed was used instead of the TAL-PITCh vector. Except for abnormally developed embryos, phenotypes were divided into four groups (full, half, ectopic and normal) according to the expressed region of EGFP. Total numbers of individuals are shown at the top of each graph.

