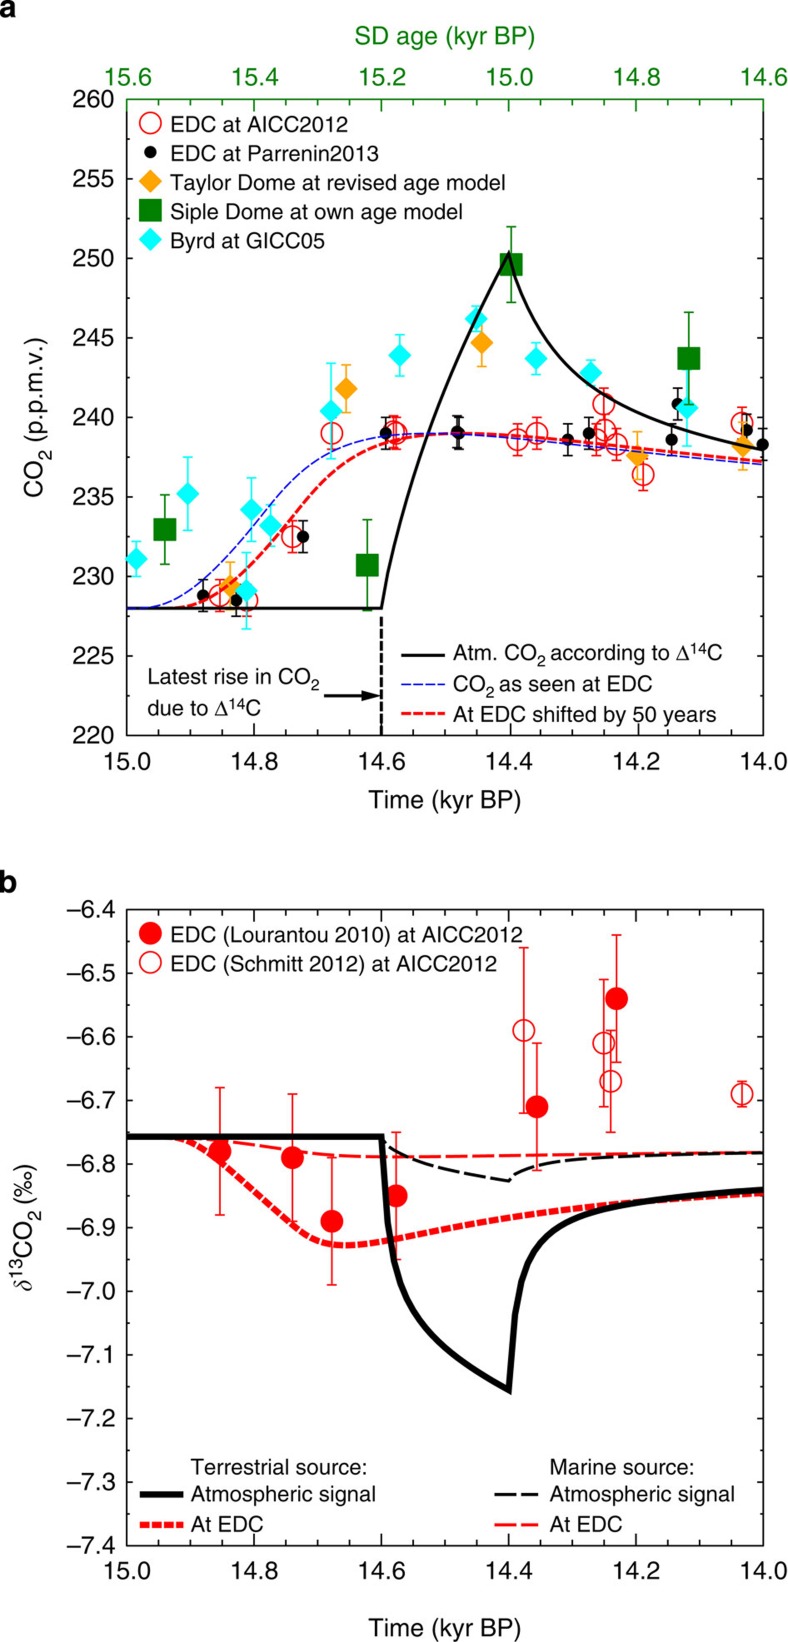
Figure 3. Ice core and simulated true atmospheric CO2 and δ13CO2.
(a) Ice core CO2 data (±1σ) from EDC1,22,68 on two different chronologies3,4 AICC2012 and Parrenin2013, Taylor Dome on revised age model26,27, Siple Dome on own age model (top x axis)27, Byrd on age model GICC05 (refs 25, 28). Simulated true atmospheric CO2 in our best-guess scenario according to 14C data (black bold line), filtered to a signal that might be recorded in EDC (blue dashed line), shifted by 50 years to meet the EDC data (dashed red line). (b) Ice core δ13CO2 data (±1σ) from EDC1,68, simulated true atmospheric δ13CO2 of our best-guess scenario and how it would have been recorded in EDC for either terrestrial or marine origin of the released carbon, implying a δ13C signature of −22.5 or −8.5‰, respectively.

