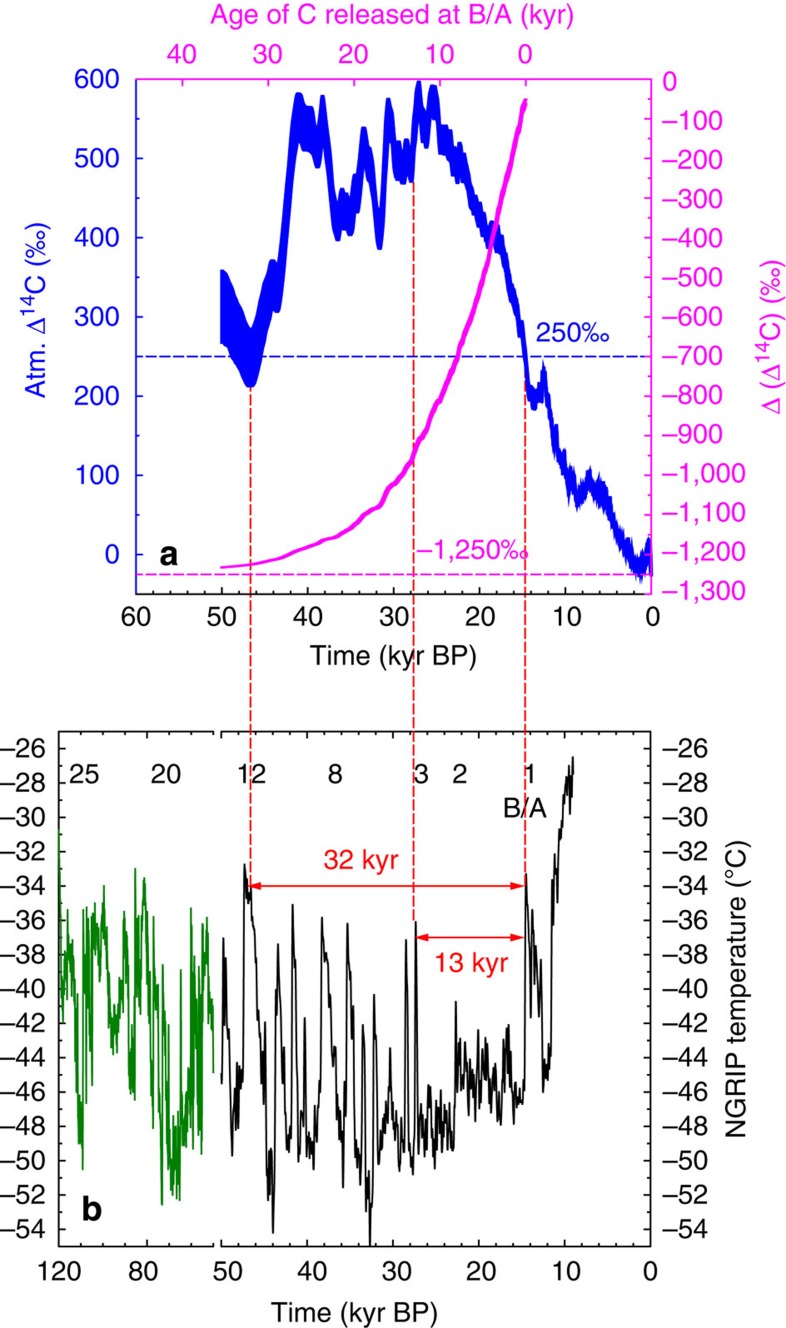
Figure 6. Radiocarbon depletion of soil carbon of different age and high northern latitude climate change.
(a) Atmospheric Δ14C based on IntCal13 (ref. 9) over the last 50 kyr (blue, left y axis, mean ±1σ). Calculated radiocarbon depletion resulting in Δ(Δ14C) (mean ±1σ) of soil carbon released during the B/A as a function of its age (magenta, right y axis, upper x axis) and of atmospheric Δ14C during time of production. (b) NGRIP temperature reconstruction33 from 120 to 10 kyr BP. The time series is plotted in two different colours because of the break in the x axis scale at 50 kyr BP. Numbers label selected D/O events. Red labelled arrows highlight the time which past since NGRIP was similar as warm as during the B/A (32 kyr since D/O event 12) and since the previous significant warming before the B/A (13 kyr since D/O 3).

