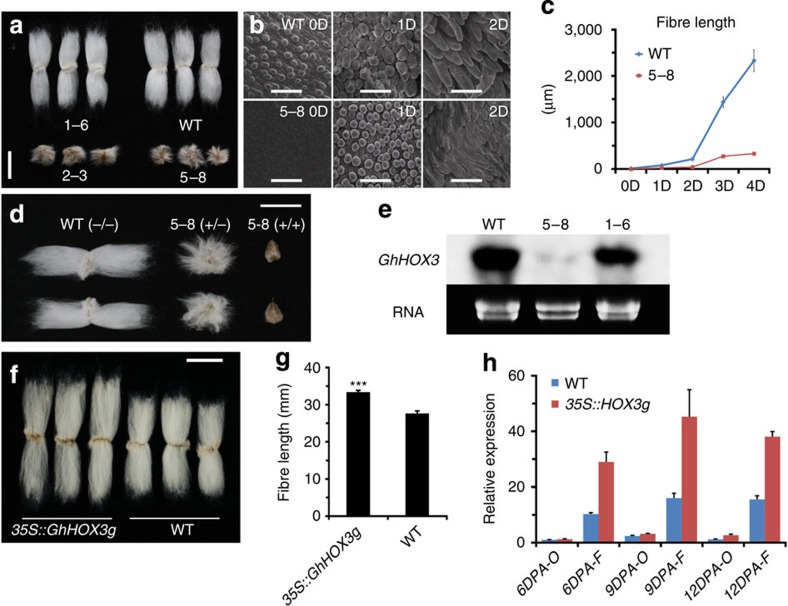
Figure 1. GhHOX3 expression affects cotton fibre elongation.
(a–e) Phenotypic analysis of 35S::GhHOX3 transgenic plants. Wild-type (WT) cotton and three transgenic lines are shown, of which two (5–8 and 2–3) exhibited co-suppression. (a) Images of fibre of 35S::GhHOX3 lines, T2 generation. Scale bar, 1 cm. (b) Scanning electron microscope (SEM) images of the ovule (0–2 DPA) of the co-suppression line 5–8 and the WT. Scale bars, 50 μm. (c) Mean fibre length at 0–4 DPA (mean±s.e.m., n>100). (d) Fibre of homozygous and heterozygous 35S::GhHOX3 co-suppression line 5–8 (T6 generation). Heterozygotes were generated by back-crossing the T5 plants to the WT. Scale bar, 1 cm. (e) Northern blot of GhHOX3 expression in fibre (9 DPA) of the WT and the 35S::GhHOX3 (5–8 and 1–6) lines. (f) Images of fibre from a T2 plant of the 35S::GhHOX3g (genomic) transgenic line. Scale bar, 1 cm. (g) Mature fibre length of a 35S::GhHOX3g cotton line (mean±s.e.m., n=30, ***P<0.001, Student’s t-test). (h) Quantitative reverse transcription-PCR analysis of GhHOX3 expression levels in 35S::GhHOX3g ovule (O) and fibre (F), T2; DPA or D, DPA. Data are shown as mean±s.e.m. (n=3).

