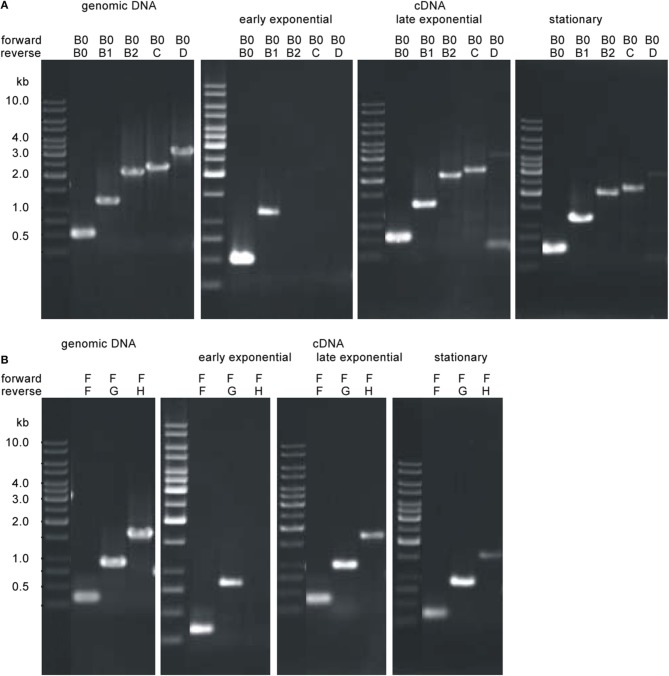
Figure 7.
Transcriptional analyses of the P. furiosus flagellar operon depending on the growth phase. Total RNA was isolated from cells of early exponential growth phase (~1 × 10⁷ cells/ml; panel 2), late exponential growth phase (4–5 × 10⁷ cells/ml; panel 3) and stationary growth phase (~2 × 10⁸ cells/ml; panel 4) and transcribed into cDNA; transcripts were amplified by PCR using different sets of primers. PCR data using genomic DNA as positive control is shown in panel 1. Results are shown exemplarily for two different potential cotranscripts. (A) Analysis of the potential cotranscript flaB0-flaD. Forward primer was Pfu-flaB0_f, reverse primers were Pfu-flaB0_r to Pfu-flaD_r. (B) Analysis of the potential cotranscript flaF-flaH. Forward primer was Pfu-flaF_f, reverse primers were Pfu-flaF_r to Pfu-flaH_r.

