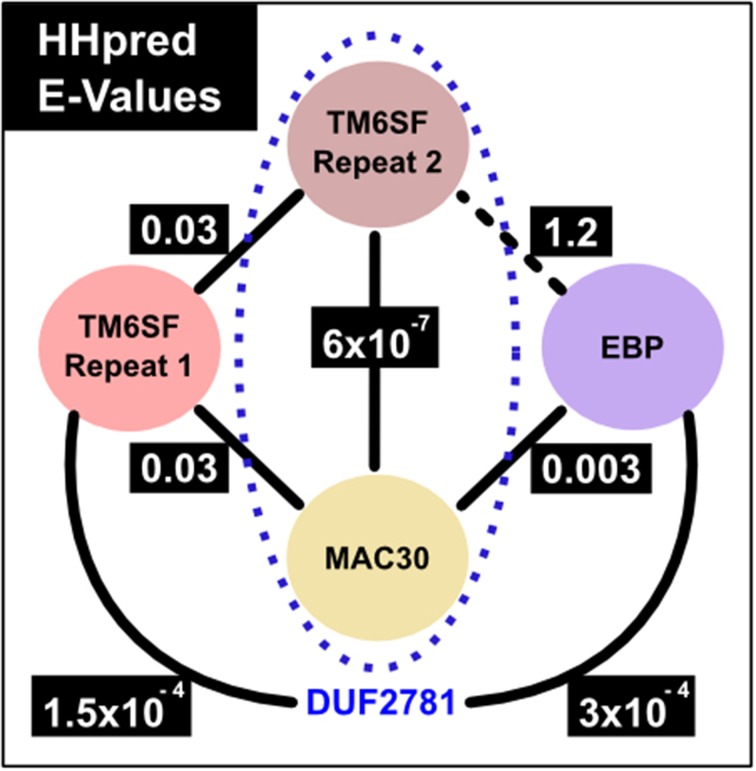
Figure 4.
HHpred comparison E-values. The numbers correspond to E-values from HHpred (Söding et al., 2005) profile searches against a Pfam profile database which includes profiles that represent families shown in the figure. Profile-to-profile matches were evaluated in terms of an E-value, which is the expected number of non-homologous proteins with a score higher than that obtained for the database match. An E-value much lower than one indicates statistical significance. Solid lines represent statistically significant sequence similarity relationships, e.g., the MAC30/TMEM97 family calibrated profile finds with 0.003 and 0.03 E-values the profiles of EBP family and TM6SF first EXPERA repeat, respectively. The black dotted line between TM6SF second EXPERA domain repeat and EBP shows the unique relationship found with a non-highly significant value (E-value 1.2). The sequence similarity between TM6SF (second EXPERA domain repeat) and MAC30/TMEM97 families (presented inside the blue dotted oval) was already described in a DUF (Domain of Unknown Function) entry of Pfam (DUF2781, Pfam family identification: PF10914) (Bateman et al., 2010; Punta et al., 2012).

