Fig 4.

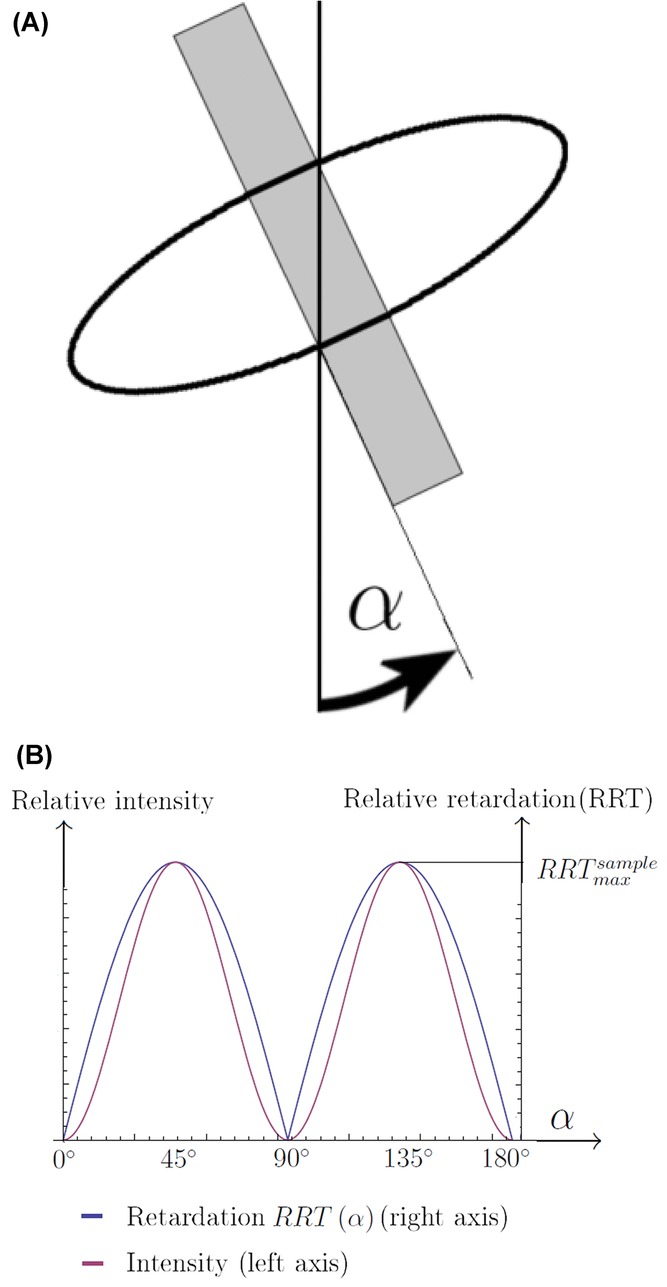
(A) The sample orientation angle α defined relative to the crossed polars. The vertical line is the analyser axis. (B) Schematic illustration of how RRT and relative intensity depend on the sample orientation angle α.

(A) The sample orientation angle α defined relative to the crossed polars. The vertical line is the analyser axis. (B) Schematic illustration of how RRT and relative intensity depend on the sample orientation angle α.