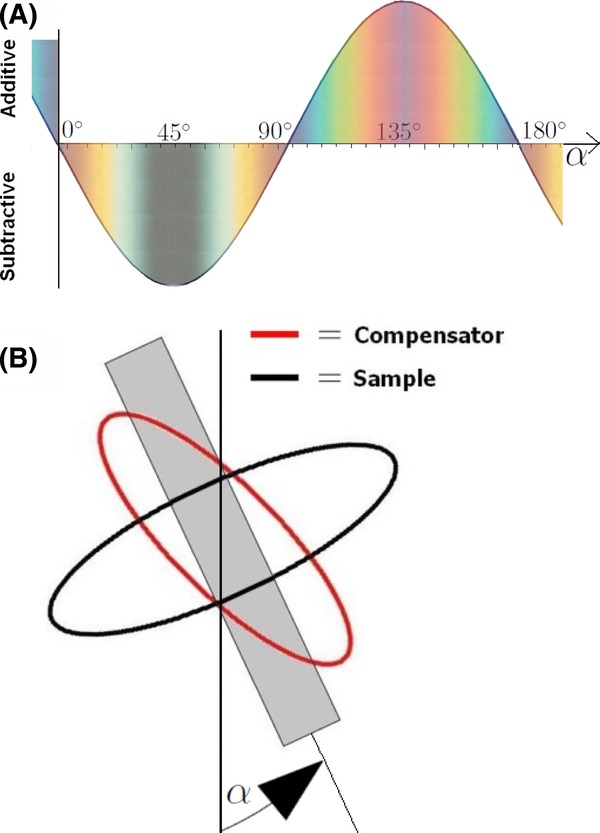
Fig 6.

(A) The total retardation as a function of the sample orientation angle α for a sample with positive elongation. The expected observable colours are also shown, from the Michel–Levy birefringence chart (Fig. 5). Note the blue and yellow hues for α close to  . (B) Wavefront ellipses of the compensator and sample, vertical line represents the analyser axis.
