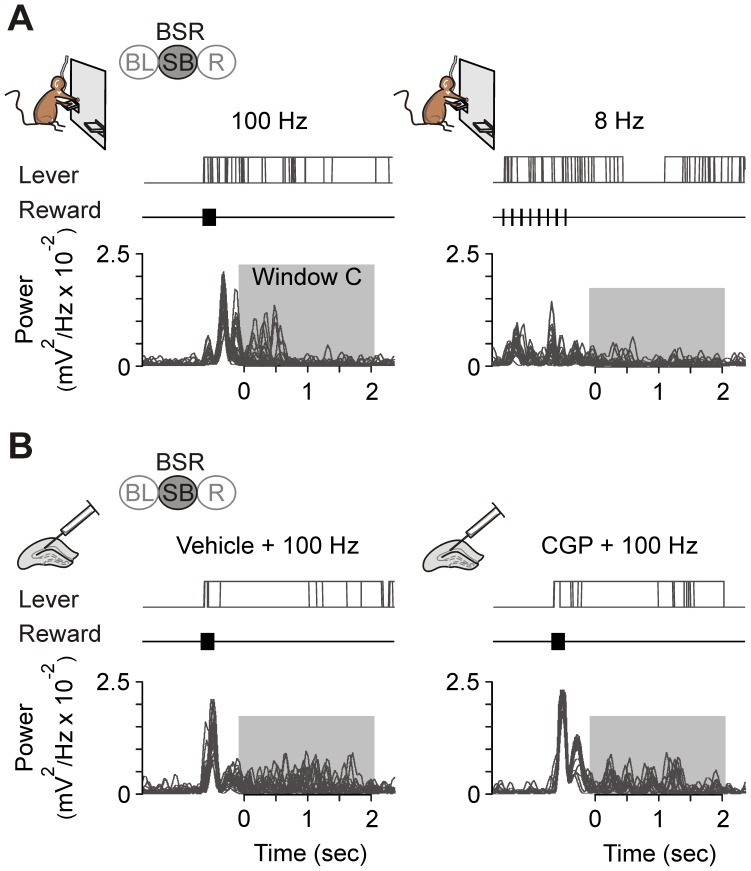
Figure 5. Power spectra in the low theta band evoked by the different reinforcement frequencies and by the local injection of CGP 35348 during time window C, and their relationship with the number of lever presses.
(A) Power spectra values collected from a representative animal. From top to bottom are illustrated lever presses (Lever), the reward train (Reward), and the power value corresponding to the low theta (3–5.8 Hz) band. Two frequencies of reward tested (100 Hz, 20 Hz) are shown in relation to lever-press activity. Each section (panels 4 s long) corresponds to 30 overlapped sweeps (the lever trace remains high for the time that the lever is held down) as well as their corresponding power values in the low theta band. Gray squares indicate time window C. Note the increase in power spectrum values related to the preferred frequency of reinforcement (100 Hz). This increase was not associated with lever activity. (B) Power values collected—always using 100 Hz of reward—from a representative mouse in two different sessions: vehicle and CGP injections. Traces are displayed as in A. Note that the increase in power values during vehicle administration sessions was clearly larger than during CGP sessions. Again, no relationship with lever activity was noticed. Code bars at the top in A and B are defined in Figure 1.

