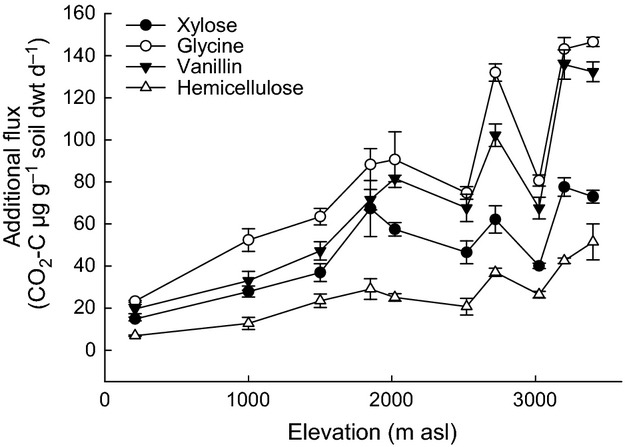
Figure 4.

Soil respiration responses to four C substrates in 11 soils from a tropical elevation gradient incubated at 20 °C. Data represent mean ± SE (n = 5) of the additional CO2 flux (SIR-BR). Two-way anova and Tukey's HSD pairwise comparisons are presented in Table3 and Table S1. SIR, substrate-induced respiration; BR, basal respiration.
