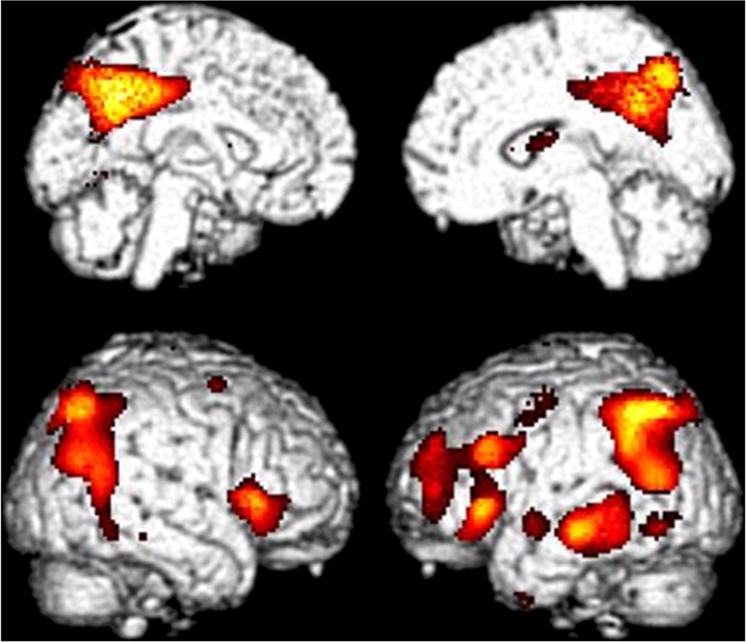
Figure 2.

Statistical Parametric Mapping of FDG-PET images comparing subjects in the High Frontal/Parietal (HF/PA) FDDNP binding subgroups with Subjects in the Low Global (LG) FDDNP binding subgroup. The color scale highlights the location of all cortical voxels (p < 0.01) in which lower metabolism occurred in the HF/PA group than in the LG group., Hypometabolism in HF/PA relative to LG was found in the following regions: right perisylvian, with peak significance at 38,20,4; t = 5.05, p < 0.0005, pvoxelcorrected = 0.03; left mid-temporal gyrus with peak significance at −70, −28, −12; t = 4.66, p < 0.0005; left inferior parietal/ parietotemporal hypometabolism with peak significance at −56, −50,44; t = 4.64, p < 0.0005, pclustercorrected = 0.001; bilateral posterior cingulate cortex (right greater than left), with peak significance at 6, −54,38; t = 4.59, p < 0.0005, largest cluster with 6992 contiguous voxels, pclustercorrected < 0.0005; Left dorsolateral prefrontal cortex, with peak significance at −38,52,30, t = 3.84, p < 0.0005, pclustercorrected = 0.01.
