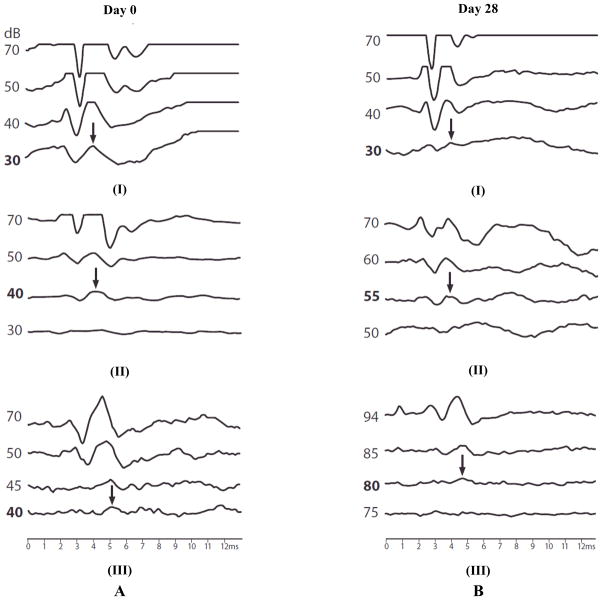
Fig. 1.
Representative ABR tracings at 32 kHz obtained on (A) Day 0 before intratympanic injections and (B) Day 28 after the injections in guinea pigs in vivo. The differences among the Day 0 tracings are due to experimental variability. ABR tracings are from (I) control, (II) 0.05 mL, and (III) 0.1 mL injection experiments. The arrows and bold dB values indicate the ABR threshold values.

