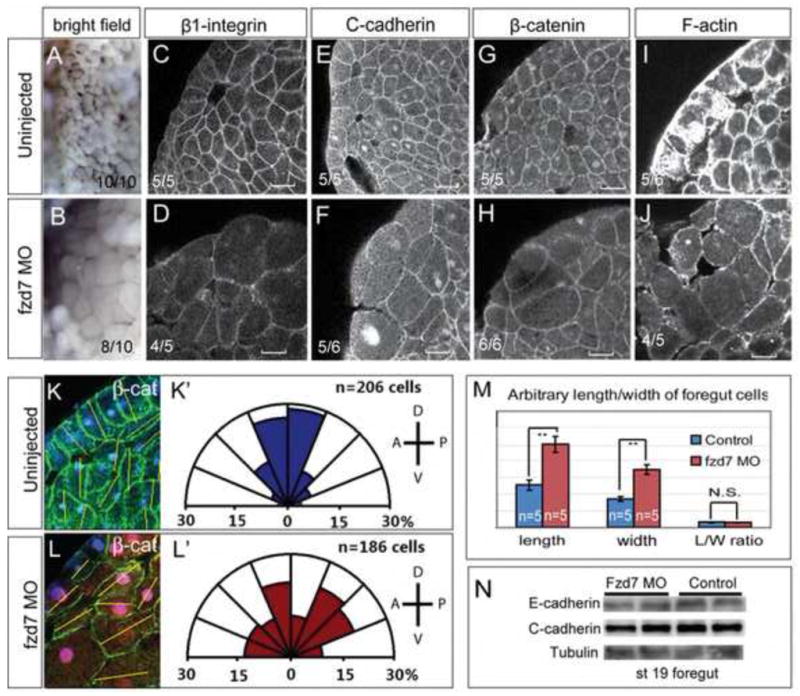
Figure 3. Fzd7-depletion causes defects in foregut cell morphology.

(A–B) Bight field view of the foregut surface at stage 20 showed that Fzd7 morphants exhibit larger loosely adherent cells (B), compared to controls (A). (C–J) Confocal immunostaining of the foregut (anterior left, dorsal up) with μ1-integrin (C,D), C-cadherin (E,F), β-catenin (G,H) and phalloidin (F-actin) (I,J) showed decreased cell adhesion molecules and reduced cytoskeleton in the enlarged foregut cells of Fzd7 morphants. All of the images were taken using same setting for control and fzd7-MO embryos. (K–L) Quantitation of cell size and orientation; foregut cell length, width and orientation in control (K) and fzd7-MO injected embryos (L) were measured from β-catenin immunostaining (green) using Image-J. Nuclei shown in blue, fzd7-MO/RLDx in red. All images were oriented with dorsal up. The yellow line marks the long axis of foregut cells, and quantification shows the frequency of orientations of the long axis of cells in Fzd7 morphants (L,L′) and control (K,K′) n= the total number of foregut cells from 5 uninjected (K′) and 5 fzd7-MO embryos (L′). (M) The relative length, width, and length/width radio in control and Fzd7-depleted foregut cells. **p<0.01 relative to controls in Student’s t-test (N) Western blot analysis shows no significant changes of total E-cadherin and C-cadherin level in the foregut explants.
