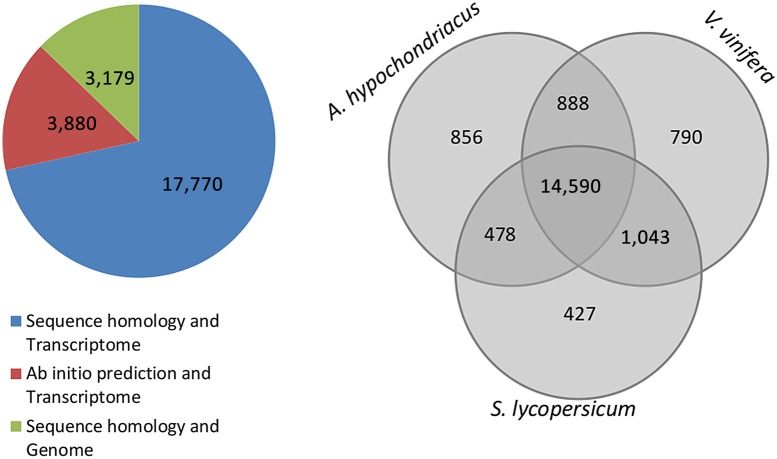
Figure 5.
Comparative proteome analysis of A. hypochondriacus, V. vinifera and S. lycopersicum. The pie chart shows the source of evidence for proteins from the assembled transcriptome and genome. 17,770 proteins find evidence in both homology and presence in the transcriptome, 3,880 are ab initio predicted with presence in the transcriptome, and 3,179 are those with only evidence from homology to known plant proteins. The Venn diagram compares the total numbers of A. thaliana genes that are orthologous to the respective genomic scaffolds of A. hypochondriacus, V. vinifera and S. lycopersicum with 14,590 proteins common to all the three species representing three major clades under dicots. This figure appears in colour in the online version of DNA Research.

