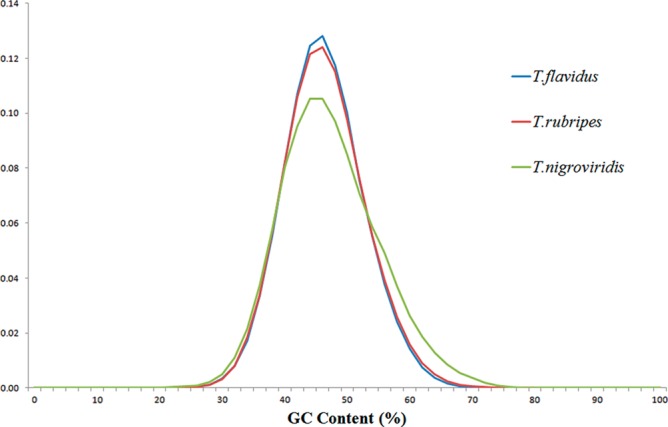
Figure 1.

The GC contents of the T. flavidus genome. The size of sliding window was 500 bp. The horizontal axis was the percentage of GC in the windows, whereas the vertical axis showed the frequency of windows. The GC contents of genomes of T. rubripes and Tetraodon nigroviridis were shown for comparison. This figure appears in colour in the online version of DNA Research.
