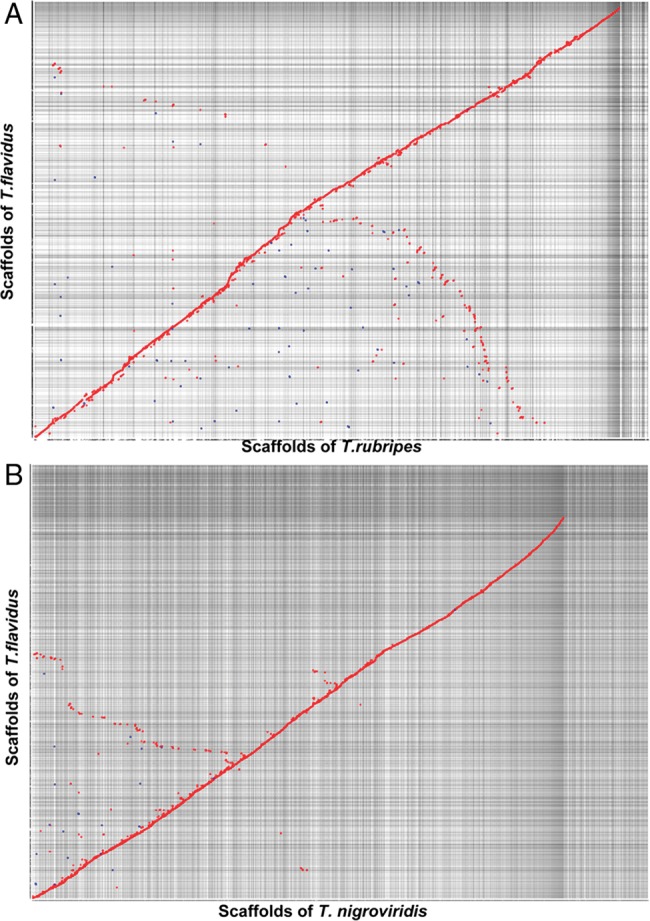
Figure 2.

The scaffolds synteny between genomes. Scaffolds from T. flavidus were aligned with that from T. rubripes (A) and Tetraodon nigroviridis (B). The units on the X/Y axis represented the number of scaffolds. Forward matches were shown as red dots, whereas reverse matches were shown in blue dots. This figure appears in colour in the online version of DNA Research.
