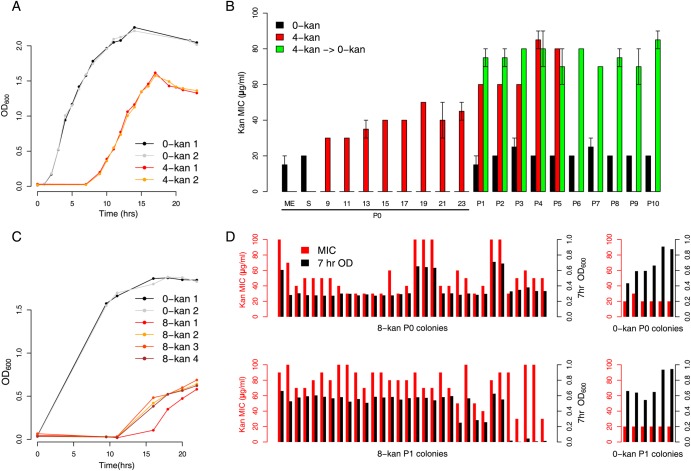
Figure 1.
Resistance developed as a result of growth in sublethal kanamycin concentration. (A) Growth of two replicate populations of Escherichia coli MG1655 in ∼25% of the lethal level of kanamycin (4 µg/ml: 4-kan 1 and 2; for additional growth curves, see Supplementary Figure S3A). Control populations in plain LB are 0-kan 1 and 2. Populations at various time points from the 4-kan curves were sequenced while only mid-exponential- and stationary-phase populations from the 0-kan curves were sequenced. (B) MICs of evolving populations. P0 indicates the first round of growth in kanamycin (i.e. the growth curves in A) while P1–P10 indicate serial transfers by 100-fold dilution. Black bars indicate MIC levels of control populations passaged in plain LB (0-kan). Red bars indicate populations evolving in 4-kan, with data available for multiple time points in P0. Green bars indicate populations grown in 4-kan in P0 but subsequently transferred into plain LB for the remaining passages P1–P10 (4-kan → 0-kan). The maintenance of increased MIC levels suggests the presence of resistant mutations and not a temporary stress response. The average MIC level of the two biological replicates (from three technical replicates) is plotted with the total length of the positive and negative error bars representing the difference in MICs between the two replicates (range). (C) Growth of four replicate populations of E. coli MG1655 in ∼50% lethal levels of kanamycin (8 µg/ml: 8-kan 1-4; more growth curves can be found in Supplementary Figure S3). (D) Isolates derived from (four replicates of) the P0 8-kan and the P1 8-kan populations were tested for their MIC (red bars) and growth in plain LB (black bars, taken at 7 h. after inoculation). Many isolates in P0 were sick, i.e. had a lower OD600 in plain LB but could resist kanamycin. The incidence of these sick isolates decreases after P1, and fit resistant forms seem to dominate. For comparison, kanamycin MICs (red bars) and OD600 (black bars) of multiple isolates, from P0 and P1 control wild-type populations grown in plain LB, are shown in the right panels.

