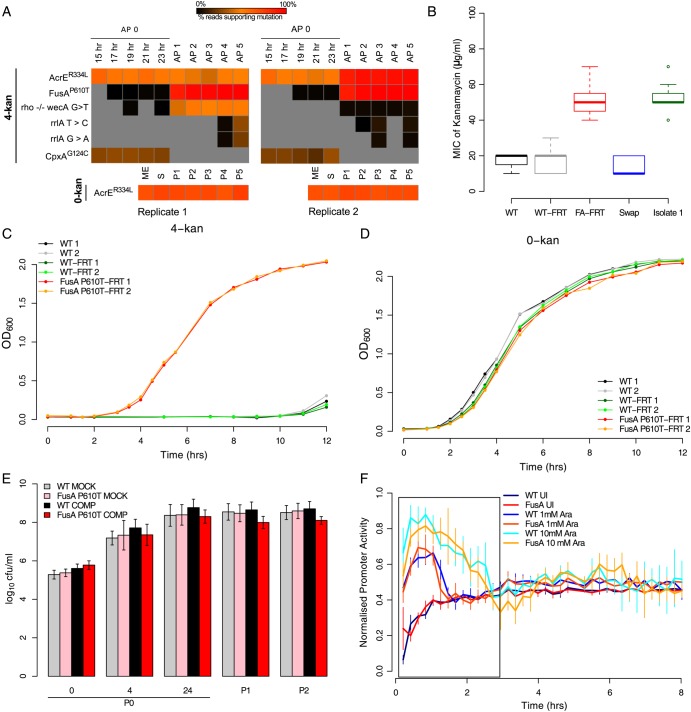
Figure 3.
FusAP610T confers low-cost resistance to kanamycin. (A) Heat maps indicating the proportion of reads supporting a given mutation (red—100% of reads support the mutation; black—close to 0%, i.e. very low; grey—0%, i.e. not detectable). Each column represents a time point, and the mutations are represented by rows (AP0-5: passages in 4-kan; 15–23 h: time points in AP0; ME, S and P1-5: mid-exponential- and stationary-phase time points in passage 0 and passages 1 through 5 in 0-kan; replicates are indicated below the heat map). Standard single letter amino acid representations have been used to denote substituted reside at the indicated position in superscripts. Intergenic region (IGR) mutations are represented by a ‘−/−’ between the genes flanking the IGR and the nucleotides found modified are indicated with a ‘>’. For simplicity, mutations found only in 4-kan populations are shown. However, since AcrER334L was also present in the control, the mutation is included separately below. While the mutation in fusA reaches (true, i.e. 100%) fixation in 4-kan populations by P3, it is also detected in the initial round of growth (P0) albeit at very low levels. AcrER334L fixes along with FusAP610T in the second replicate but remains in the first replicate at an intermediate level. This maintenance can be explained only if FusAP610T arose again in this background (see Supplementary Figure S8: Sanger-sequenced isolates suggest this scenario). A mutation in cpxA is also seen in AP0 in both replicates, but it is lost in subsequent passages as the mutation in fusA picks up. (B) The FusAP610T mutation alone confers ∼3-fold resistance to kanamycin. This panel shows box plots (as defined in description of Figure 2C) of MICs (n = 8) for the wild-type strain into which the FusAP610T mutation was transferred by phage transduction (FusAP610T-FRT; named so as the FRT site remains near the gene after the process). Controls wild type (WT), wild type with the FRT site at the same locus (WT-FRT) and the (back-swap) control in which the FusAP610T mutation was replaced with the wild-type allele by phage transduction are also shown along with a representative 4-kan population isolate in which the FusAP610T mutation was confirmed by Sanger sequencing. (C) Growth curves of wild type (WT) and FusAP610T-FRT in plain LB (0-kan) and (D) in LB + 4 µg/ml kanamycin (4-kan). In the absence of kanamycin, the FusAP610T strain grows almost as well as wild type. (E) The FusAP610T-FRT strain competes well against the WT-FRT strain in plain LB. Bold colours represent the competition experiment (see Methods), whereas the light colours represent the mock competition experiment (both strains were grown separately and mixed prior to plating). Plotted are log10 colony forming units (cfu)/ml versus the time point {error bars represent relative error in y, [0.434 * (dy/y)], from pooled multiple counts from two independent replicates; dy: standard deviation}. (F) Promoter activities (normalized to fall between 0 and 1) for GFPmut2 induction are similar in the wild type and the FusAP610T mutant, suggesting the absence of any defects in translation in this mutant. GFPmut2 induction from the PBAD promoter in WT-FRT and FusAP610T-FRT for two different concentrations of arabinose is shown (1 mM: 1 Ara; 10 mM: 10 Ara and uninduced control: UI). Induction was done in plain LB; period of peak promoter activity is represented by a box (error bars indicate standard deviation for four replicates). For induction in presence of kanamycin, see Supplementary Figure S10C.

