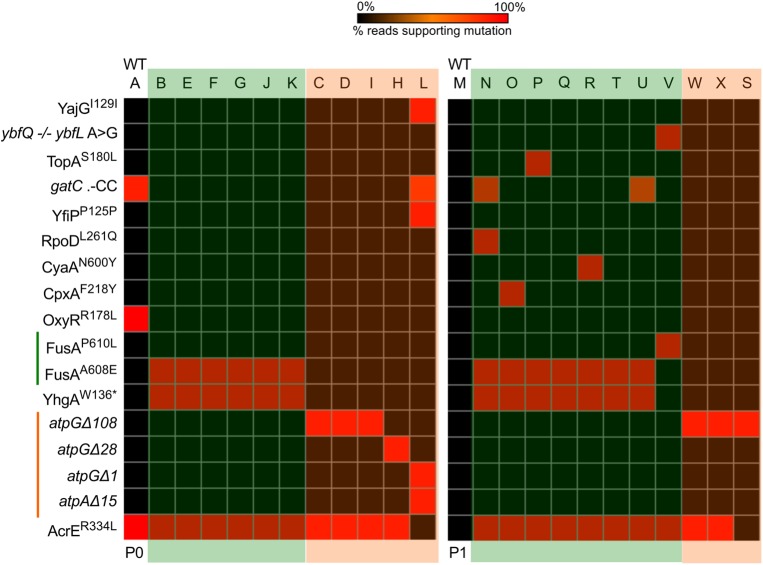
Figure 4.
Deep sequencing of isolates reveal two groups of mutations in the 8-kan evolving populations. Heat maps with the presence/absence of mutations in the isolates. Each column represents an isolate, and the mutations are represented by rows. Passage number is indicated below. The control isolate is the first column in either passages (indicated by WT). Both 0%, i.e. not detectable, and values close to 0% are represented with black for ease of visualization; for isolates, any low percentage SNPs can be ignored. The isolates can be easily put into two groups: those with a point mutation in fusA and those with deletion(s) in subunits of the ATP synthase complex. In P1, a constellation of other mutations can be seen. These second site mutations occur only in the FusAA608E background. Also, another fusA variant (FusAP610L) emerges in this passage. Standard single letter amino acid representations have been used to denote substituted residue at the indicated position in superscripts. ‘*’ indicates a STOP mutation. Δ indicates a deletion of nucleotides indicated by the number beside the symbol. Intergenic region (IGR) mutations are represented by a ‘−/−’ between the genes flanking the IGR and the nucleotides found modified are indicated with a ‘>’. Insertion of ‘two cytosines’ in the gene gatC is represented as .-CC.

