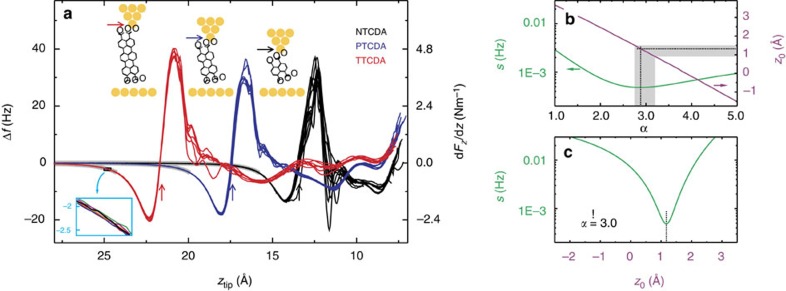
Figure 2. Determination of the force law.
(a) Averaged frequency shift Δf curves from individual contacting experiments. The Δf on tip approach has been subtracted from the curves (see Supplementary Fig. 4). All curves are z-aligned at large ztip where molecule and surface are well separated. The absolute z-scale is obtained by comparison to simulations24 (see Supplementary Fig. 5). The arrows indicate where each molecule is detached from the surface with cartoons at the top showing the respective geometries. The inset exemplifies reproducibility and noise level for TTCDA. The grey background marks the part of each curve that is used in the fit. (b) Fit quality s and fit parameter z0 for different force law exponents α. The best fit is obtained for z0=1.3 Å at α=2.85 (dotted lines). The corridor of physically reasonable z0 values (and of the respective exponents α) is shaded grey. (c) Fixing the exponent to α=3, we obtain a sharp minimum in s at z0=dAu(111)/2 (dotted line).

