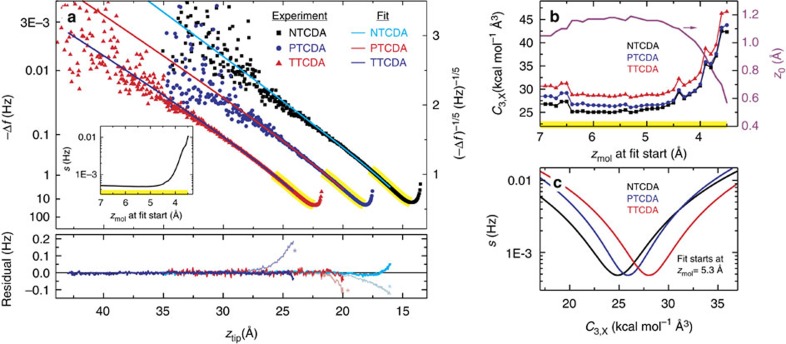
Figure 3. Determination of the asymptotic vdW coefficients.
(a) Plot of the experimental Δf data for the detached molecules (on a (−Δf)−1/5 scale). The starting point of the fit intervals was varied within the yellow-marked regions that correspond to molecular heights 3.5 Å<zmol<7.0 Å. The displayed fits to the experimental data (solid lines) have been obtained for a starting point of zmol=5.3 Å. The inset shows how the fit quality s depends on the starting point of the fit interval. We show the residuals of each fit and compare them with the residuals (marked by an asterisk) obtained in a fit where all C3,X are constrained to be identical, that is, without superlinearity. (b) Best-fit parameter values z0, C3,N, C3,P and C3,T as a function of the fit interval starting point. We obtain unphysical values if the asymptotic force law of equation (3) is used too close to the surface. (c) Dependency of the fit quality s on the change of a single C3,X parameter. The three other fit parameters remain at their optimal values from b. The start of the fit interval was set to zmol=5.3 Å.

