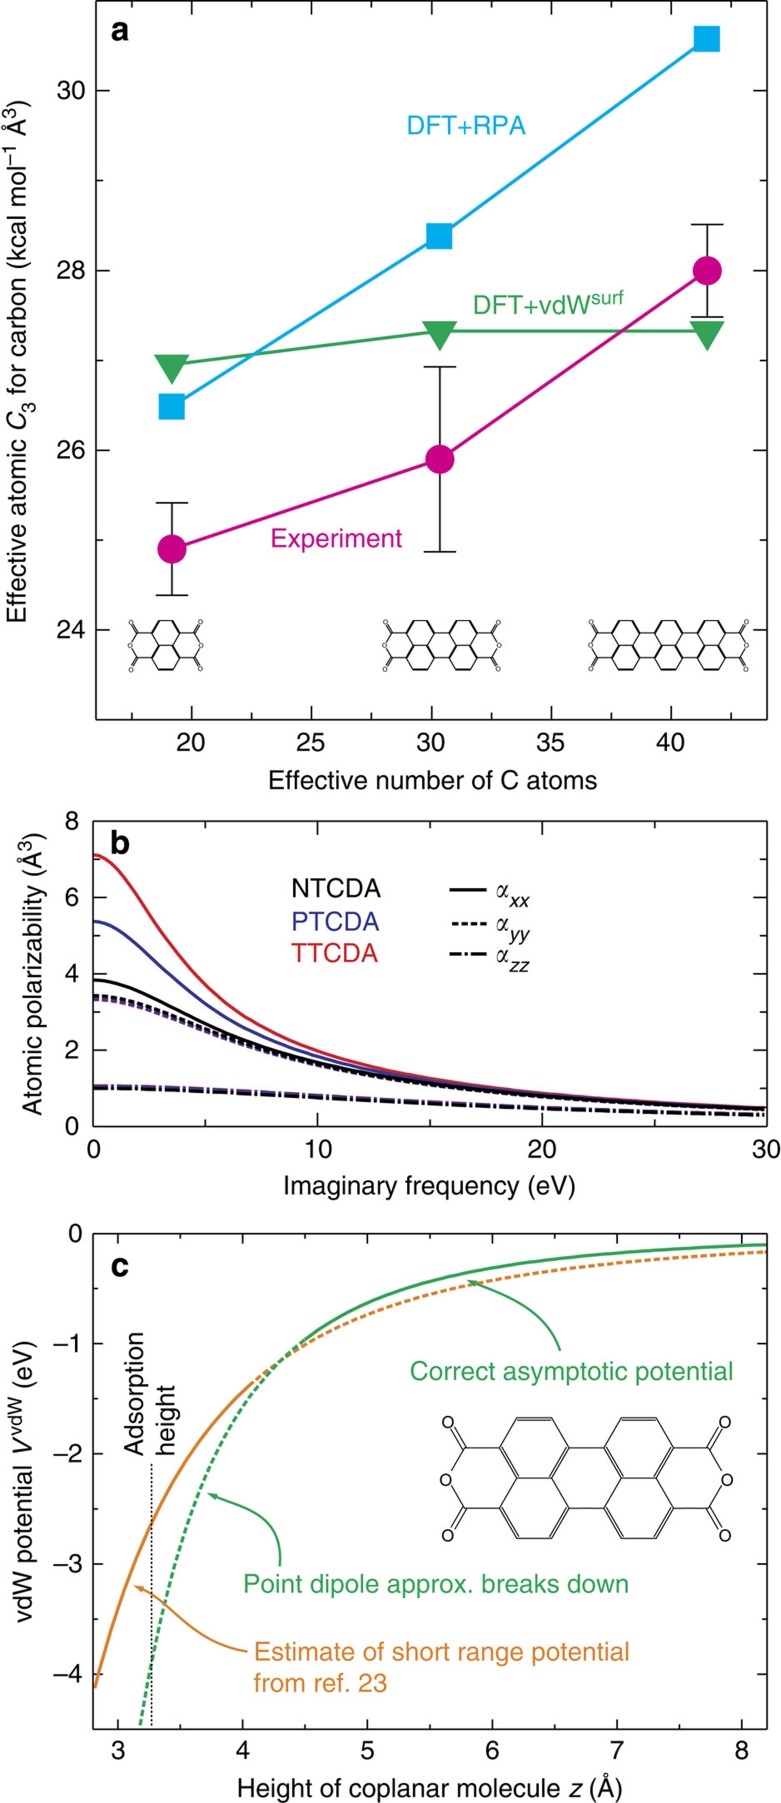
Figure 4. Experimental results and comparison with theory.
(a) Summary of the experimentally obtained C3 values. The experimental error bars indicate the uncertainty in the C3 coefficients due to the influence of the experimental noise on the fitting routine. Calculated values from the semi-empirical dispersion correction scheme vdWsurf and from DFT+RPA are also shown. (b) Dynamic per-atom polarizabilities of carbon for NTCDA, PTCDA and TTCDA as resulting from RPA calculations. The coordinates x, y and z refer to the directions along the long axis, short axis and perpendicular to the plane of each molecule. (c) The true vdW potential of PTCDA (coplanar to the surface) deviates from the asymptotic form (green) at small molecule-surface separations (compare Fig. 3b). The potential close to the adsorption height is estimated by the orange curve calculated on the basis of ref. 24, while the true vdW potential is an interpolation between the two branches. The invalid parts of both potentials are dashed.

