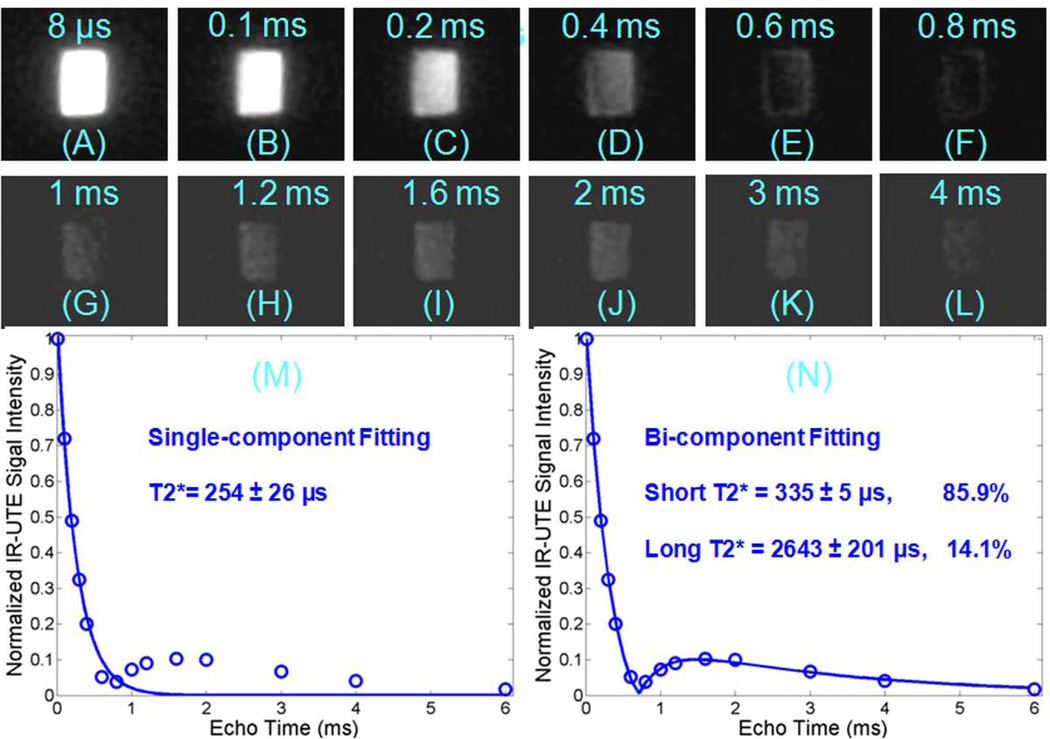
Figure 4.
IR-UTE imaging of a bovine cortical bone acquired with a TR of 300 ms, TI of 20 ms, and TEs of 0.01 (A), 0.1 (B), 0.2 (C), 0.4 (D), 0.6 (E), 0.8 (F), 1.0 (G), 1.2 (H), 1.6 (I), 2.0 (J), 3.0 (K), 4.0 ms (L), as well as the corresponding single-component (M) and bi-component fitting (N). The signal decayed to a minimum at about 0.8 ms (F), increased again to a peak at about 1.6 ms (I), then decayed again with increasing TE (J–L). The single component fit is poor with residual signal more than 10% (M), but the bi-component fit is excellent (N), with 85.9% of the signal from the bound water component and 14.1% from the pore water component.

