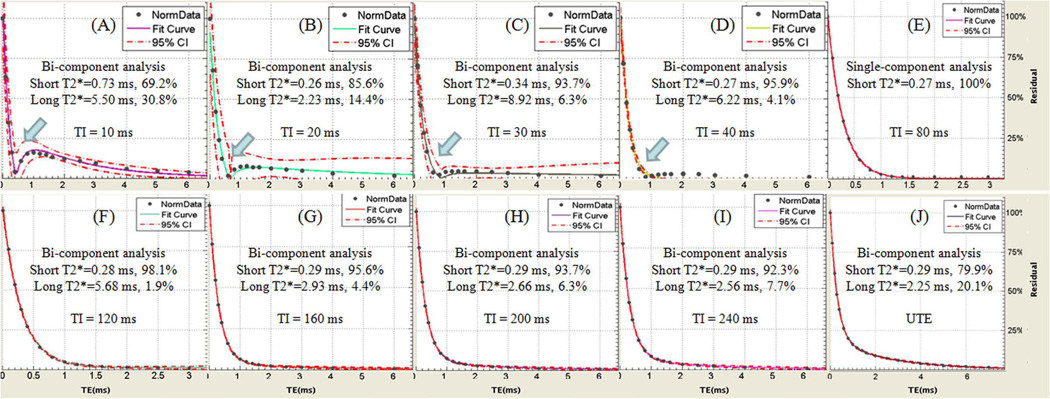
Figure 5.
Bi-component fitting of IR-UTE (A–I) and UTE(J) images of a bovine cortical bone sample with TIs of 10 ms (A), 20 ms (B), 30 ms (C), 40 ms (D), 80 ms (E), 120 ms (F), 160 ms (G), 200 ms (H), 240 ms (I). UTE signal shows bi-component decay with 20% pore water and 80% bound water (J), while a single component was observed with a TI of 80 ms (E). Bi-component decay was observed with other TIs lower and higher than 80 ms due to imperfect nulling of the pore water components.

