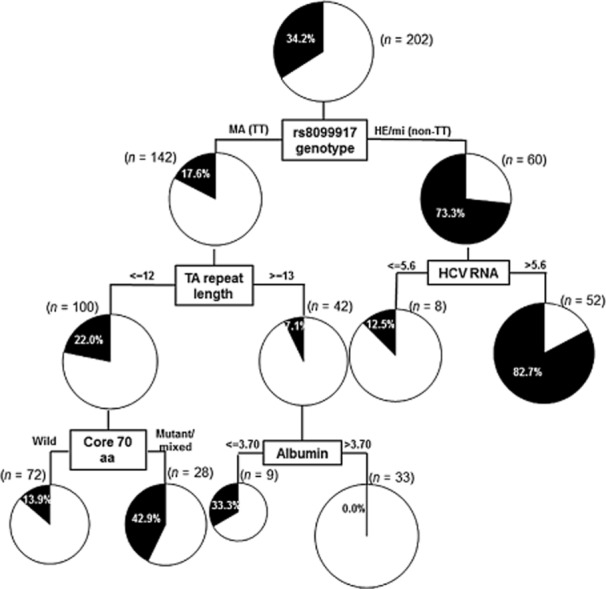
Figure 4.

Decision tree analysis for the virological outcomes. Boxes indicate the factors used for splitting and the cut-off value for the split. Pie charts indicate the rate of non-virological response for each group of patients after splitting. A total of 202 patients were included in this analysis, after excluding 13 patients who were lost to follow-up, in order to avoid the influence on final decision. Among 22 pretreatment factors (gender, prior history of interferon, pegylated interferon regimen, age, body weight; serum albumin, aspartate aminotransferase, alanine aminotransferase, total bilirubin, alkaline phosphatase, γ-glutamyl transpeptidase, total cholesterol; white blood cell, hemoglobin, platelets; FIB-4; serum levels of hepatitis C virus (HCV) RNA (reverse transcription–polymerase chain reaction), core 70/91 amino acid mutation, interferon-sensitivity determining region mutation; rs8099917 genotype, TA repeat length) tested for their abilities to predict non-virological responses, determinations of (TA)n of rs72258881 and/or the HCV core 70 amino acid substitution were useful, especially for patients with the TT genotype. In the patients with a non-TT genotype, HCV viral load was the second most important determinant of virological response. MA, major-homo; HE, hetero; mi, minor-homo; aa, amino acid. The units used to measure levels of albumin and HCV RNA were g/dL and Log IU/mL, respectively.
