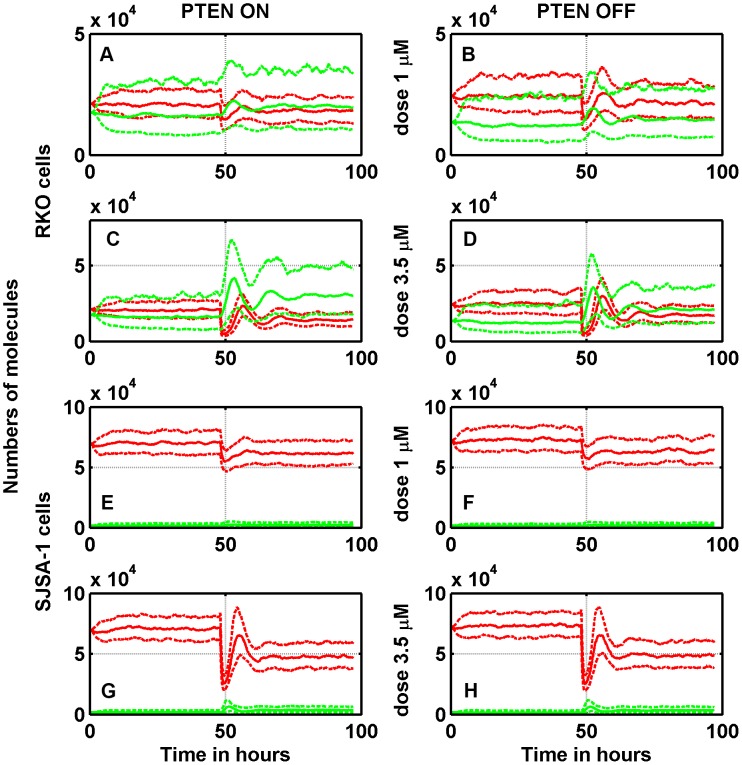
Figure 3. Time-courses of the phosphorylated nuclear p53 (green) and nuclear Mdm2 (red) in response to two different Nutlin extra-cellular concentrations in RKO and SJSA-1 cells.
Solid lines represent medians, and dotted lines first and third quartiles. The Nutlin exposure begins at  . Left column: PTEN feedback loop is active; right column: PTEN feedback loop is inactive.

