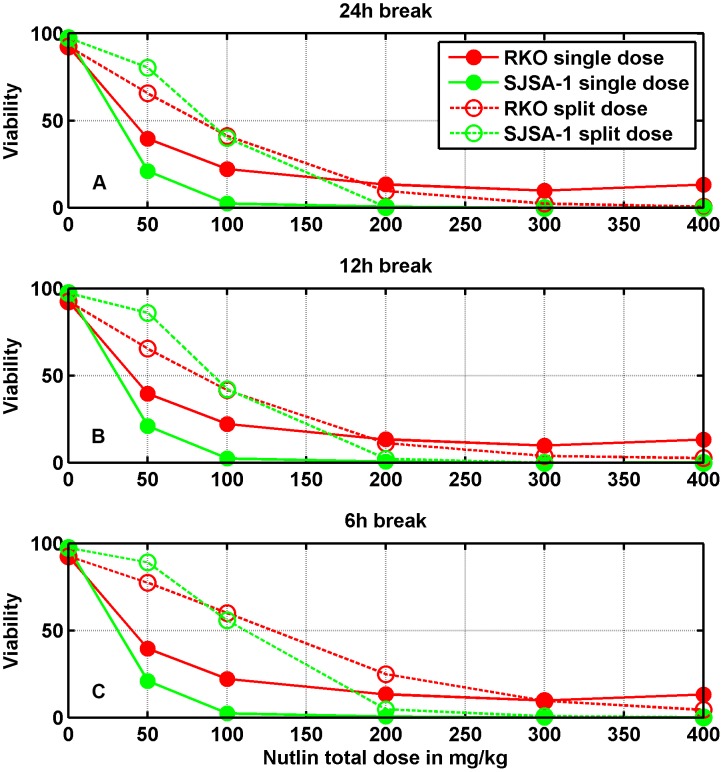
Figure 6. Prediction of the percentage of cell viability after oral dosage in mice.
Filled symbols correspond to single dose delivery (in all panels), open symbols to the case in which the total dose was split into four equal doses given with 24 h breaks (panel A), 12 h breaks (panel B), and 6 h breaks (panel C). Cell viability was assessed 120 h after the first dose.

