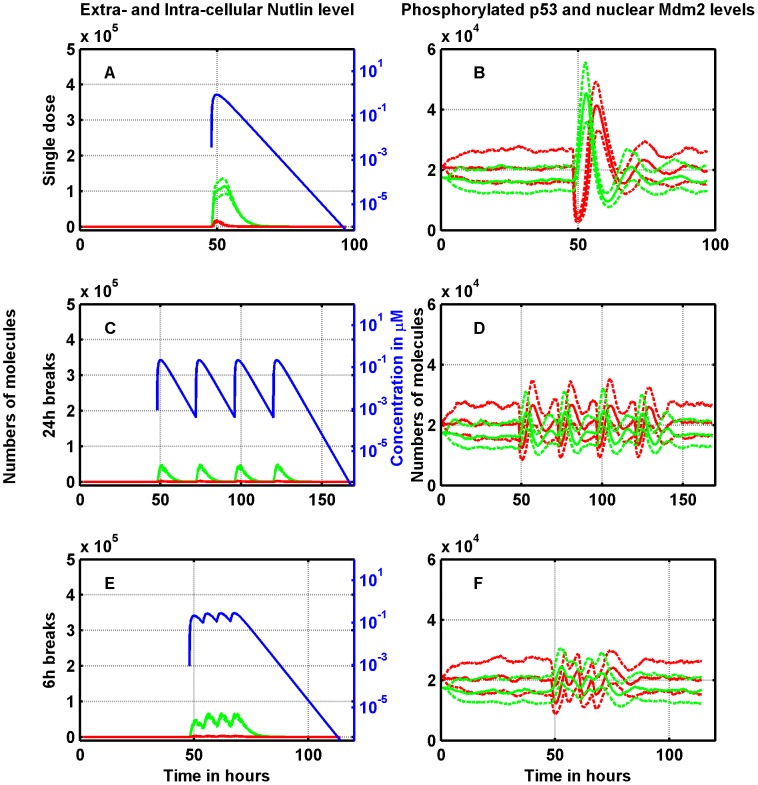
Figure 7. Single-dose vs. split delivery of a total dose of 50 mg/kg of Nutlin: Effects on the RKO cell line.
Left panels: dynamics of Nutlin. Extra-cellular free concentration (blue, on the log scale), total intra-cellular amount (green), free intra-cellular amount (red). Right panels: time-course of p53 (green) and Mdm2 (red). Upper panels: single dose. Central panels: the dose is split in four doses delivered with an interval of 24 hours in between. Lower panels: again the dose is split in four doses, but here the time between two doses is 6 hours. Solid lines represent medians, and dotted lines first and third quartiles.

