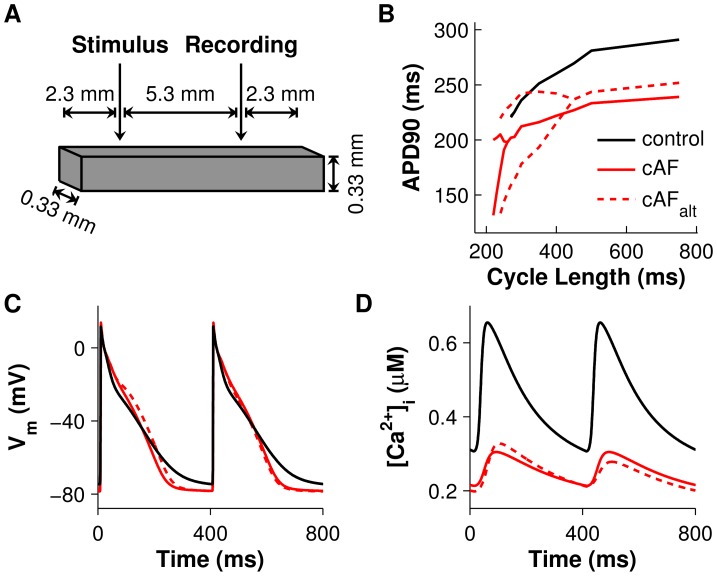
Figure 1. Tissue preparation setup and comparisons of control, cAF, and cAFalt tissue during pacing.
(A) Atrial tissue mesh with stimulus and recording electrodes. (B) APD restitution curves for control tissue (black), cAF-remodeled tissue [19] (red), and cAFalt tissue with APD alternans onset and amplitude matching clinical data [8] (dotted red line). The RyR inactivation rate constant (kiCa) was reduced 50% in the cAF model to create the cAFalt model. APs (C) and CaTs (D) recorded from the last two beats at 400-ms pacing CL. Alternans are present in the cAFalt tissue but not in control or cAF tissue.

