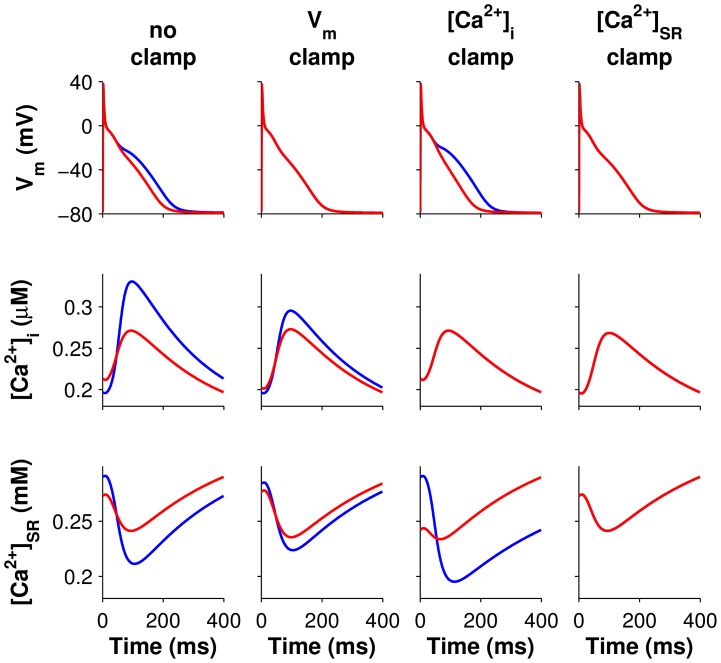
Figure 5. Voltage and Ca2+ even beat clamps for the single-cell cAFalt model.
Traces of transmembrane potential (Vm, row 1), intracellular Ca2+ ([Ca2+]i, row 2), and SR Ca2+ ([Ca2+]SR, row 3) from two consecutive beats are superimposed to show alternans between even (red) and odd (blue) beats. Column 1: the unclamped cAFalt cell paced to steady state at 400-ms CL displayed alternans in Vm and Ca2+. The red traces depicted in column 1 were used to clamp Vm (column 2), [Ca2+]i (column 3), or [Ca2+]SR (column 4). Alternans persisted when Vm or [Ca2+]i is clamped, but clamping [Ca2+]SR eliminated alternans.

