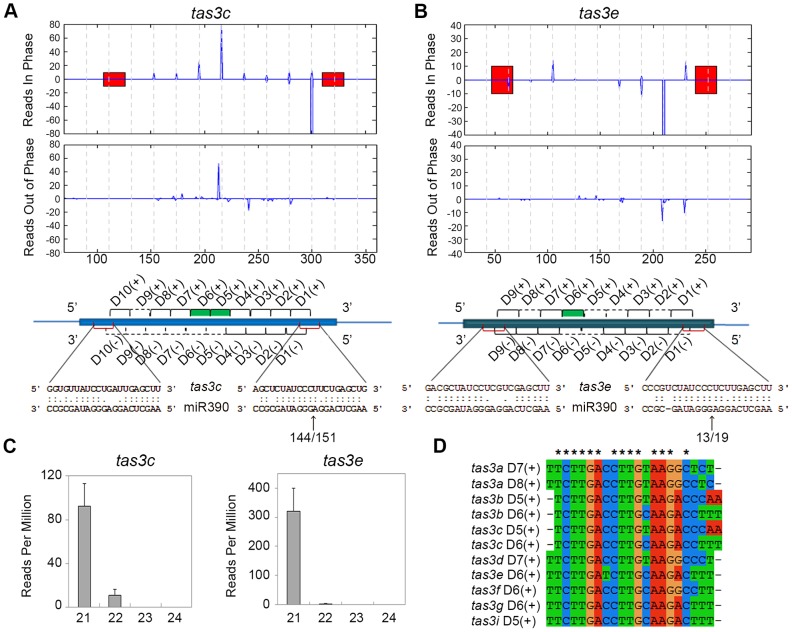
Figure 2. Organization of TAS3 loci generating phased 21-nt ta-siRNAs.
(A, B) Normalized read counts (RPM) for ta-siRNAs in phase with the 3′ miR390 cleavage site (top graphs) and for out of phase small RNAs (bottom graphs) are shown for tas3c (A) and tas3e (B). Red bars, miR390 binding sites; vertical dashed lines, the 21-nt register. Annotations of the TAS3 precursors are shown beneath, with alignments of miR390 to the tas3c and tas3e precursors and the number of PARE signatures in the small window (WS) over the large window (WL) at the 3′ miR390 target sites indicated. Black brackets; ta-siRNAs detected in the vegetative apex libraries; dashed lines, predicted ta-siRNAs not detected in our libraries; red brackets, miR390 binding sites; green bars, tasiR-ARFs. (C) Size distribution profiles for small RNAs derived from tas3c and tas3e showing most are 21-nt long. Values shown are the mean normalized read counts (RPM) and SD from three independent biological replicates. (D) Alignment of the eleven tasiR-ARFs processed from the maize TAS3 loci. Asterisks indicate 100% identity.

