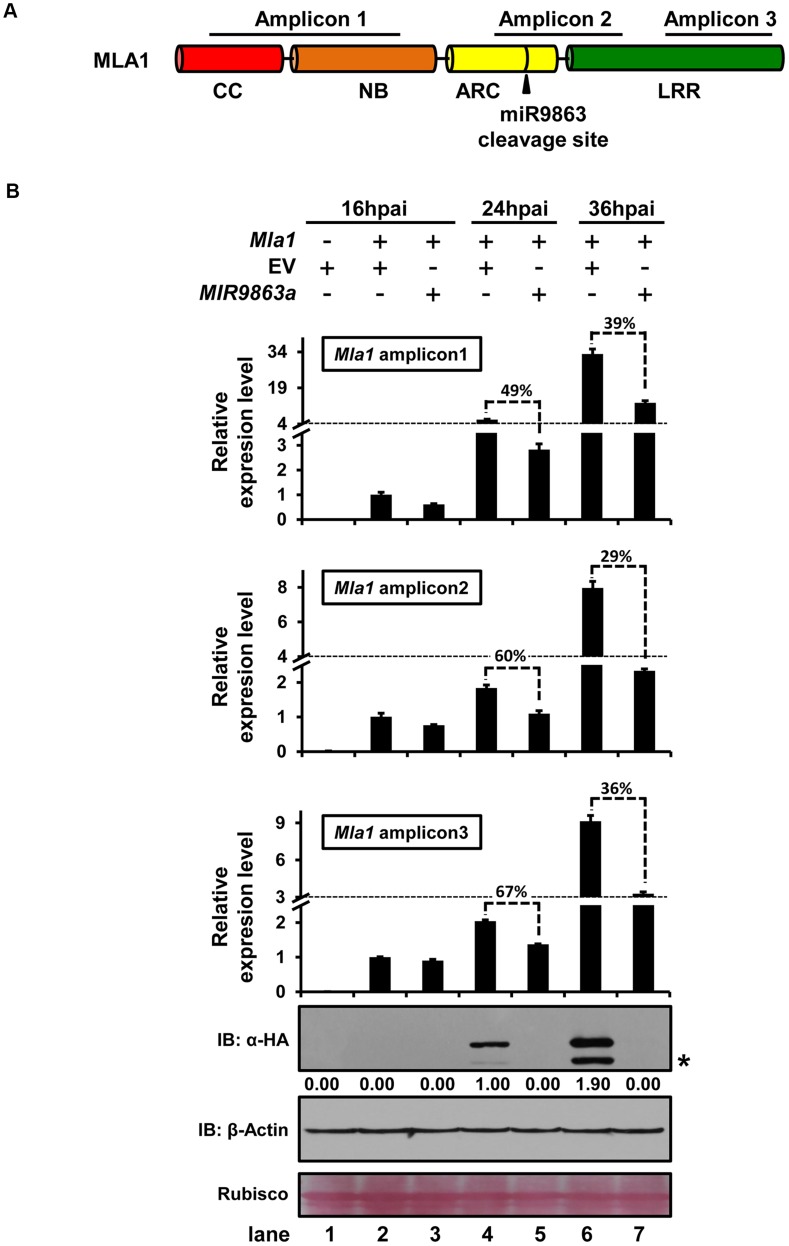
Figure 7. miR9863a regulates Mla1 mRNA and MLA1 protein in an uncoupled manner.
(A) Schematic representation of Mla1-encoded domain structure and positions of amplicons for qRT-PCR quantification of Mla1 mRNA level. Amplicon 1, 2 or 3 positions at 5′, over or 3′ of the miR9863 cleavage site, respectively. (B) Quantification of Mla1 transcript and protein level at different time points post co-expression of Mla1-3HA with MIR9863a in N. benthamiana. The relative levels of three Mla1 amplicons were analyzed for samples of three time points, 16 and 24 and 36 hours-post-Agro-infiltration (hpai), by qRT-PCR quantification. For each amplicon, relative level was shown as fold-changes compared to the level at 16 hpai after first normalized to actin for each time point. The percentage above the bars indicates the remaining level of the amplicons relative to that of the EV control. Samples used for protein quantification were collected at 2 hrs after taking samples for mRNA quantification allowing sufficient time for protein translations. Western blots shown are exposed for more than 2 hrs. The asterisks indicate non-specific signals. All the experiments were performed at least twice with similar results.

