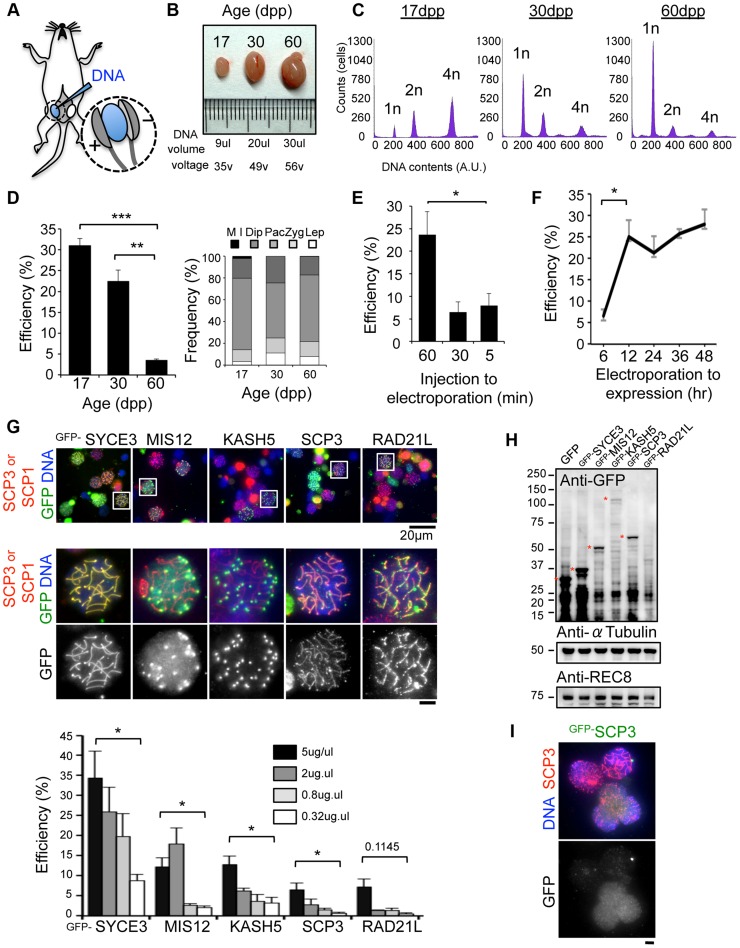
Figure 1. Optimization of EP procedures.
A, Diagram of in vivo EP procedures for mouse testis highlighting the injection of a DNA solution into the rete testis and the application of an electric pulse. Detailed procedures are shown in S1, S2 Figures. B, Testes from mice of the indicated postnatal ages. The volume of DNA solution and the voltage of the electric pulse are indicated. C, Progression of spermatogenesis analyzed by flow cytometry. Peaks correspond roughly to mitotic cells (2n), spermatocytes (4n) and post-meiotic haploid cells (1n). D, The average GFP-SYCE3 expression efficiencies in testes from mice of the indicated ages. GFP positive cells were counted among the SCP1 positive cell populations (>1000 cells). The right graph indicates the distribution of prophase I sub-stages within testis cell suspensions from mice of the indicated ages. n = 248 (17 dpp), 330 (30 dpp) and 306 cells (60 dpp). The sub-stages are defined by SCP3 and SCP1 stainings. Lep, leptotene; Zyg, zygotene; Pac, pachytene; Dip, diplotene; M I, metaphase I. E, The average GFP-SYCE3 expression efficiencies after EP with various lag times between injection and electroporation examined as in D. Mice aged 17 dpp were used. F, The average GFP-SYCE3 expression efficiencies at various time points after EP. Mice aged 17 dpp were used. G, The localizations of GFP fusion proteins expressed by in vivo EP. Testis cell suspensions were stained with SCP3 (for MIS12, KASH5, SCP3 and RAD21L) or SCP1 (for SYCE3) in red, GFP in green and DAPI in blue. The graph shows the average GFP expression efficiencies as examined by immunofluorescence at the indicated DNA concentrations. GFP positive cells were counted among the SCP3 (for MIS12, KASH5, SCP3 and RAD21L) or SCP1 (for SYCE3) positive cell populations (>1000 cells). Mice aged 17 dpp were used. H, Western-blotting analysis of testis extracts after EP (17 dpp). Asterisks indicate the specific bands corresponding to each fusion protein. α-Tubulin and REC8 were the loading controls. I, Spermatocytes showing diffusive GFP-SCP3 signals stained for SCP3 (red), GFP (green) and DAPI (blue). Each column represents the average of three independent experiments; error bars represent S.E.M. Statistical significance (TTEST, two-tailed) was assessed (*P<0.05, **P<0.005, ***P<0.0005). Bars, 5 µm (unless otherwise indicated).

