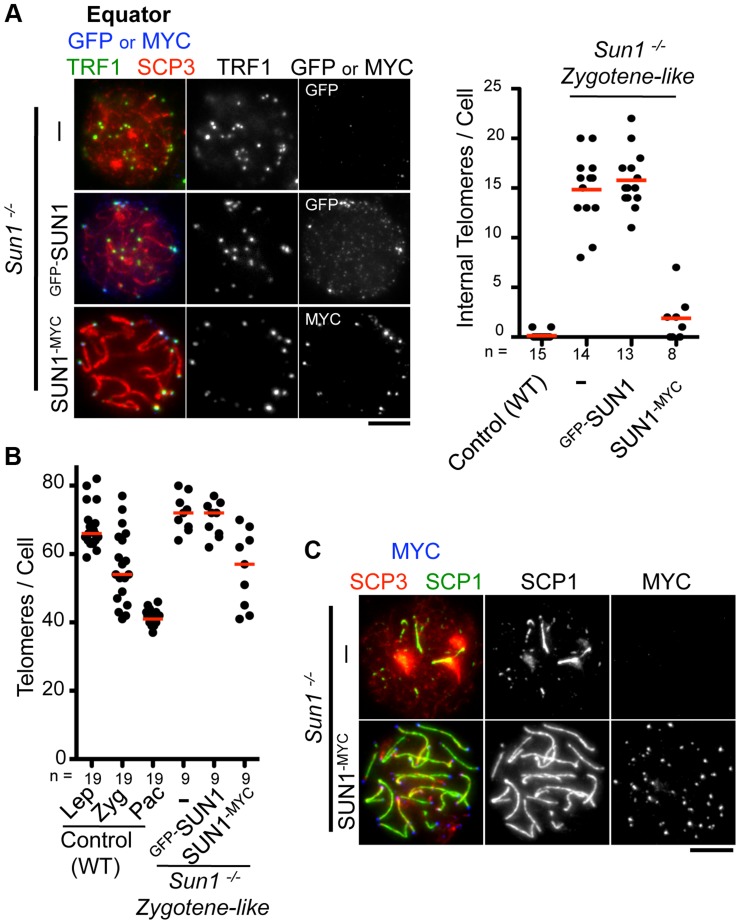
Figure 2. Complementation assay by in vivo EPs.
A, Equator images of Sun1 −/− spermatocytes expressing GFP-SUN1 or SUN1-MYC stained for telomere TRF1 (green), GFP or MYC (blue) and SCP3 (red). The graph shows the number of internal telomeres (TRF1 foci) in wild type (zygotene to pachytene), Sun1 −/− and Sun1 −/− expressing exogenous SUN1 protein. B, Quantification of TRF1 foci number in wild type, Sun1 −/− spermatocytes and Sun1 −/− spermatocytes expressing exogenous SUN1 protein. C, Representative pictures of Sun1 −/− spermatocytes or Sun1 −/− spermatocytes expressing SUN1-MYC stained for SCP3 (red), SCP1 (green) and MYC (blue). The median numbers are shown in the graphs. Bars, 5 µm.

