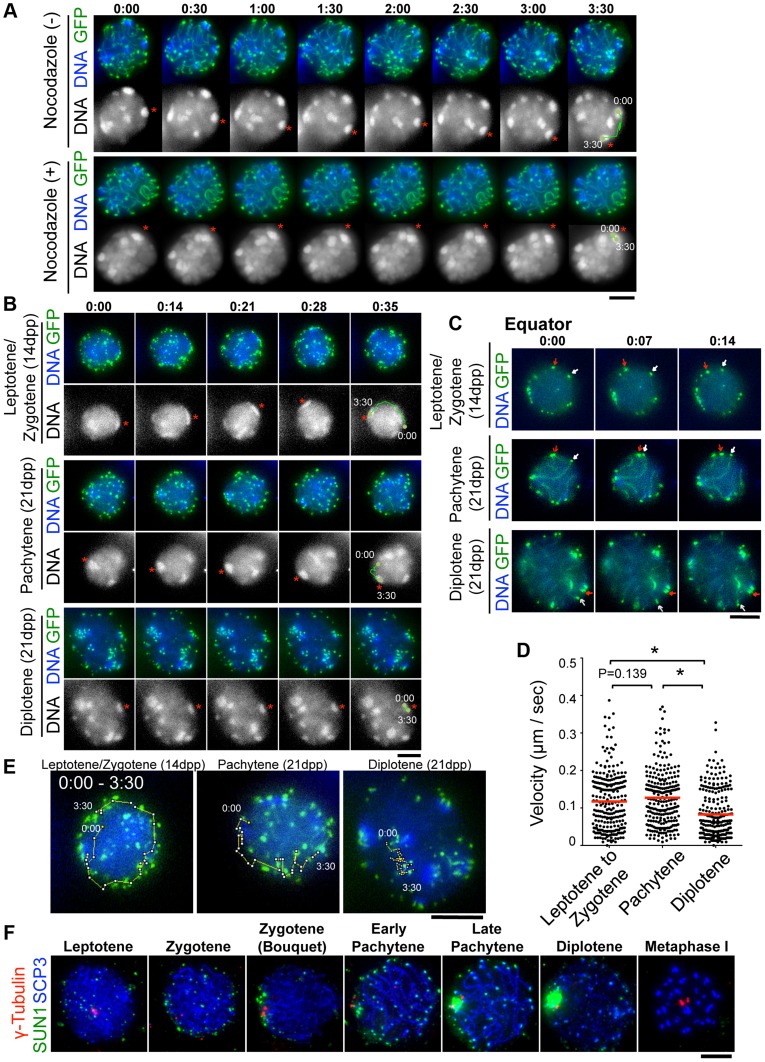
Figure 3. Visualization of stage-specific chromosome movement in live spermatocytes.
A, Time-lapse images (30 sec intervals) of pachytene spermatocytes (from 21 dpp male mouse testis) expressing GFP-TRF1 and GFP-SCP3 with or without nocodazole. Asterisks indicate identical heterochromatin. The trajectories indicate the movements of heterochromatin during the indicated time frame. Whole images are in S1, S2 Movies. B, Time-lapse images (14 sec intervals) of spermatocytes expressing GFP-TRF1 and GFP-SCP3. Leptotene/zygotene spermatocytes were from 14 dpp and pachytene to diplotene spermatocytes were from 21 dpp male mice. Asterisks indicate identical heterochromatin. The trajectories indicate the movements of heterochromatin during the indicated time frame. Whole images are in S5 Figure and S3, S4, S5 Movies. C, Equatorial images of time-lapse observations (7 sec intervals). Arrows indicate identical telomeres. Whole images are in S5 Figure and S3, S4, S5 Movies. D, Quantification of telomere velocities in various meiotic sub-stages. 5 telomeres were traced for 10 continuous time-points (7 sec intervals) for each cell (n = 5 cells), and the 3-dimensional velocities for each time-point interval are plotted. The bars represent average values. Statistical significance (TTEST, two-tailed) was assessed (*P<0.0005). E, Trajectories of a telomere (time point 0:00–3:30) overlaid on a projection of the final time points. F, Spermatocytes stained for SCP3 (blue), γ-Tubulin (red) and SUN1 (green). Bars, 5 µm.

