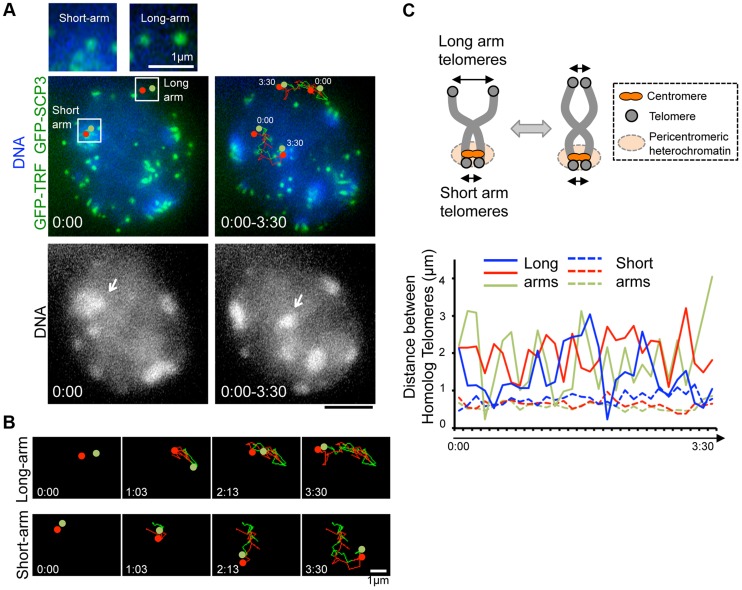
Figure 4. Inter-centromere connection observed in live-diplotene cells.
A, Diplotene spermatocytes (from 21 dpp male mouse testis) expressing GFP-TRF1 and GFP-SCP3 with the trajectories of pairs of telomeres shown by red and green (time 0:00–3:30 min), overlaid on a projection of the first (0:00) and last (3:30) time points. The arrows indicate the pericentromeric heterochromatin, on which the marked short-arm telomeres are co-localized. Magnified images show the original images of marked pairs of telomeres. Whole images are in S5D Figure and S5 Movie. B, Trajectories of pairs of telomeres shown in A at the indicated time points. The original and overlaid images are shown in S6 Figure. C, The interpretation of long-arm and short-arm telomere dynamics in diplotene stage (top). Quantification of the 3D-distances between homolog telomeres throughout the time-lapse analysis in the cell shown in A (bottom). 3 pairs of telomeres (shown as blue, red and green) were traced for 3.5 minutes (7 sec intervals) for both long-arm and short-arm telomeres. The inter-telomere distances were calculated from the original 3-dimensional data for each time-points. Whole images are in S5D Figure and S5 Movie. Bars, 5 µm (unless otherwise indicated).

