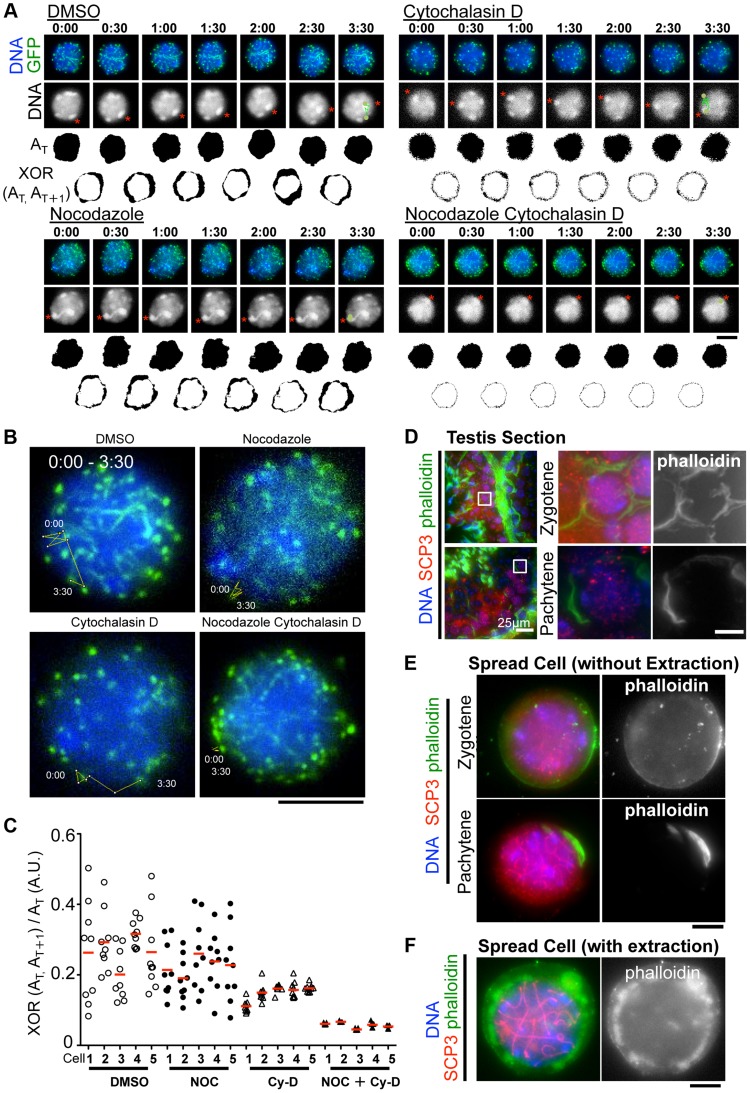
Figure 6. The different contributions of tubulin and actin to meiotic nuclear dynamics.
A, Time-lapse images (30 sec intervals) of pachytene spermatocytes (from 17 dpp male mouse testis) expressing GFP-TRF1 and GFP-SCP3 with DMSO, nocodazole, cytochalasin D or both. Asterisks indicate identical heterochromatin. The trajectories indicate the movements of heterochromatin during the indicated time frame. Whole images are in S9, S10, S11, S12 Movies. AT indicates the binary image of the DNA shape at any indicated time point. XOR (AT, AT+1) indicates the binary image of the change in nuclear shape between any indicated time point, AT and AT+1. B, Trajectories of a telomere (time point 0:00–3:30) overlaid on a projection of the last time point. C, Quantification of the relative change in the nuclear area (XOR (AT, AT+1)/AT) (10 continuous time points from 5 independent cells for each culture condition). The bars represent average values. D, Histological sections of testes from 60 dpp male mice stained for SCP3 (red), phalloidin (green) and DNA (blue). The magnified pictures show zygotene and pachytene spermatocytes. E, Zygotene and pachytene spermatocytes stained for SCP3 (red), phalloidin (green) and DAPI (blue). Cells were prepared without hypotonic treatment and then fixed without Triton-X100. F, Pachytene spermatocyte stained for SCP3 (red), phalloidin (green) and DAPI (blue). Cells were prepared with mild hypotonic treatment and then fixed with 0.1%Triton-X100. Bars, 5 µm (unless otherwise indicated).

