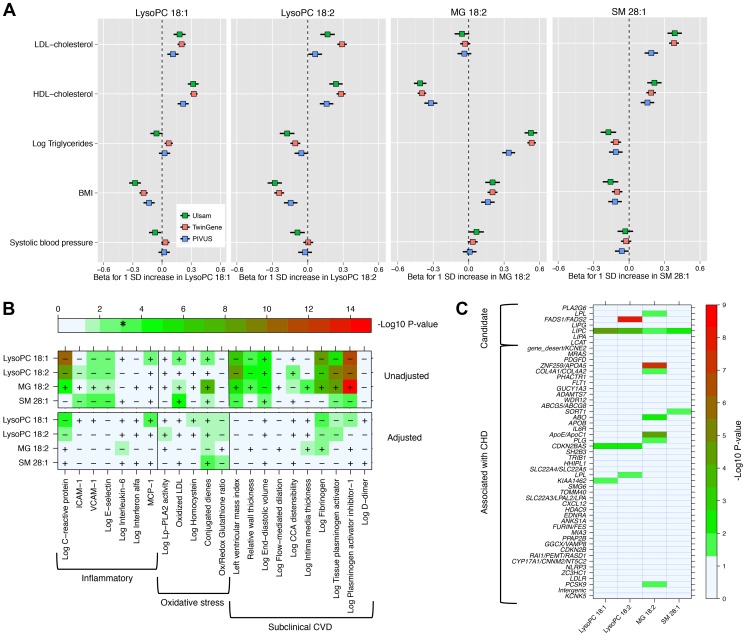
Figure 2. Association between four metabolites and cardiovascular traits and genotypes.
Panel A: Association with main cardiovascular risk factors in three population-based studies. Panel B: Minus log10(P-value) for association with markers of inflammation, oxidative stress and subclinical CVD in PIVUS. Sex-adjusted analysis (upper panel) and adjusted by sex, systolic blood pressure, body mass index, current smoker, antihypertensive treatment, LDL-C, HDL-C, log-triglycerides and diabetes at baseline (lower panel). * indicates the alpha threshold after multiple-testing correction. Panel C: Minus log10(P-value) for association with 51 SNPs previously reported for association with CHD (44 SNPs) or selected from candidate pathways (7 SNPs).

